![]()
When it comes to understanding your audience, you can’t get more granular than a website click tracking tool.
Instead of looking at big picture metrics, you can drill down to the basics and get to know what works with your audience — and what doesn’t.
While many site tracking tools exist, website click tracking tools offer the most depth when you want to better understand user behavior.
To see what I mean, visit a website you’ve never been to before. Just Google a broad topic such as “marathon training” or “best thriller novels.” It doesn’t matter.
Click on one of the search results, then explore the site as a consumer. Pay attention to where you click and what draws your attention.
That’s what website click tracking is for. You can’t look over the shoulders of all your website visitors while they’re navigating your site.
However, you can get the next best thing with click trackers.
I’ll walk you through all you need to know about how to use website click tracking tools and what to do with the results you get in the form of user behavior reports.
Plus, I’ll show you how you can combine different website user tracking software options to boost your results.
What Is Website Click Tracking?
Website click tracking uses a software program to generate reports on where website visitors click on a specific page on your website. You install a code on the backend of your site, usually in the <head> section, so the tool can connect with your site.
When someone clicks on your website, whether it’s a link or form field or something else, it sends out a signal. A website click tracking tool can receive that signal and generate user behavior reports based on that information.
It’s kind of like GPS navigation. If you have GPS installed on your phone or if you’ve used a software program to track your teenager’s car, you can access the app and see what addresses the car has visited and what routes it’s taken to different places.
User behavior reports, which come from website click tracking, provide you with a map of sorts that tells you about website visitor activity. Based on that data, you make decisions about how to redesign your site, direct visitors’ attention, and remove distractions.
When you track clicks over a long period of time, patterns begin to emerge. For instance, you might discover that a particular link in your top navigation bar receives the majority of clicks on your homepage.
If you can figure out why that link — and it’s associated page — attract such attention, you can capitalize on it.
For instance, you might want to add an email signup form to the destination page so you can capture more leads.
You could also add more content to that page so your visitors spend more time on your site.
The Best Click Tracking Tools
If you want to track website clicks, you need the best click tracking tools for the job. I recommend using more than one tool for the best results.
A good website click tracking tool allows you to generate multiple types of reports.
For instance, Google Search Console, which I’ll cover in detail below, allows you to generate tons of different reports based on the information you need.
You should use these tools to gauge overall site traffic as well. Which of the pages on your site get the most traffic? Which ones have the lowest bounce rates and the most time on page?
Focus your energy in optimizing those pages. There’s no reason to spend hours improving a page that gets 1 percent of your total traffic.
Once you’ve identified those pages, generate user behavior reports, including heatmaps and recordings. I’ll get into those in detail below.
In this stage, you’re tracking specific click activity on your pages. A website click tracking tool can generate tons of data to help you optimize not only for traffic, but also for referral source and other factors.
Google Search Console
We’ll start with Google Search Console, which is completely free to use and full of tons of information. For instance, if I want to know how much traffic I’m getting, I can generate a report.
The image is from a while back. It showed my overall traffic over 30 days.
If I filter my traffic based on pages, I can see more information. For instance, I can compare all pageviews with unique pageviews. Depending on my goals, I might want to focus on uniques because they discount multiple sessions by the same person within a 24-hour window.
You can get a lot of other data from Google Search Console by using the filters on the left-hand side of your dashboard. The further you investigate the data your website generates, the better you get to know your audience.
User Behavior Reports: Heatmaps
The next website click tracking tool you’ll want to use is a user behavior report like a heatmap.
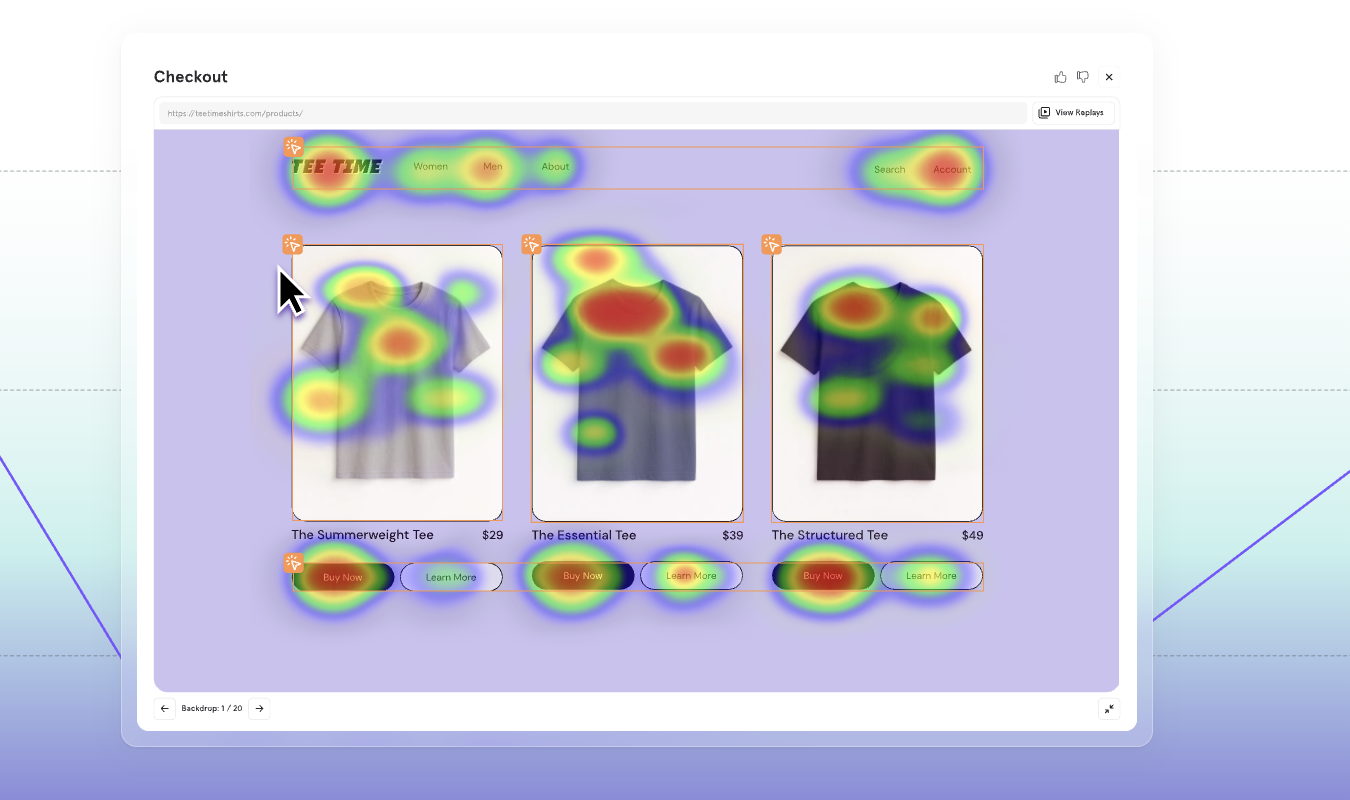
A heatmap shows you activity on a given page using color temperature.
The warm areas — red, orange, and yellow — signify more engagement with those parts of the page. The cooler areas, rendered in blue and purple, signify lower engagement.
In the example above, you’ll notice that the CTA “Schedule Now” doesn’t get many clicks. It’s very cold in the map. However, the screen lights up over the logo, top navigation, and part of the hero image.
Using this heatmap, the site owner could move the CTA to a different part of the page, use higher contrast to make it stand out more, or test more compelling CTA copy.
Crazy Egg offers five user behavior reports, including a heatmap as well as with a Scrollmap Report which allows you to see the content people are scrolling past and what content causes them to stop and take notice. Each of these five reports allows you to visually understand how your audience is interacting with your site. .
For example, let’s say you publish a lot of longform articles on your blog. A scrollmap can help you determine the percentage of your audience that actually reads to the ends of these posts.
Additionally, when you pinpoint an area where a majority of people stop scrolling, you can insert a high-quality CTA.
If you discover an area where people are consistently scrolling past the content without stopping or even choosing that point to abandon the page, try placing different content in these transition areas to provide an incentive for visitors to dive further into your site.
How to Check Clicks on a Website Using User Behavior Reports
Generating user behavior reports like a heatmap is easier than you might think when you have the right website click tracking tool.
At Crazy Egg, we call them Snapshots because they give you a photographic image of what people are doing on your site.
When you generate a Snapshot, we’ll start collecting click data as soon as visitors arrive. Once a visitor’s click has been logged, you’ll have access to your five user behavior reports: Heatmap, Scrollmap, Confetti Report, Overlay Report, and the List Report.
Be sure to keep checking in on your five Snapshot Reports regularly since you can learn more information as additional user behavior is captured.,
Each of the reports give you different insights into your visitor behavior. For instance, the Confetti Report produces dots that represent individual clicks and lets you segment your audience based on filters like browser, search term, and time to click.
The Overlay Report shows you the exact click number on every single element on your page as well as its percentage of your total clicks.
User Recordings
Visitor Recordings are another source of data that you can get from a website click tracking tool like Crazy Egg. They allow you to see in real time how website visitors behave when they interact with your pages.
You’ll be able to watch as people they click on or engage with elements on the site as well as the movements of their mouse as they explore a page.
Recordings are a way to see the clicks from your user behavior reports brought to life and can help you decide where to put CTAs, images, body copy, and other elements on your website.
They are also ideal for letting you know where visitors are getting confused. For instance, if you see people repeatedly clicking on an element and getting no response, they are most likely assuming that the element should include a hyperlink. By addressing this frustration, you not only improve the user experience, but also capture more clicks.
With Crazy Egg, you can either choose to turn on visitor Recordings when you generate user behavior reports or you can manually choose to start recording later.
Step-by-Step Instructions for Crazy Egg
To generate your user behavior reports and set up your visitor Recordings, log into your Crazy Egg account or sign up for a free 30-day trial. Once you’ve installed the code on your website — full instructions available here — you’re all set!
From your Crazy Egg Dashboard, click “Snapshots” in the left-hand menu, then click “Create Snapshot” to get started.
You can choose to create a single Snapshot or multiple Snapshots at a time. Click on the icon of your choice and then enter the URL(s) of the page(s) you want to generate reports on.
You can also decide the website display, whether you’d like to track traffic from different devices separately or all together, how long you want the Snapshot(s) to run, and whether you want to delay the start date, among other customizations.
That’s it! After you review the information you’ve provided, you create the Snapshot and wait for the data to start rolling in.
If you want to make sure your User Recordings are enabled, head over to the Recordings Settings and see if the toggle next to your website is green. Remember to use the tools together to get the most comprehensive view into your user behavior!
Why Is it Important to Track User Clicks and Learn How People Navigate Your Site?
Every website has its own unique audience. People who visit NeilPatel.com will navigate it differently from people who visit CrazyEgg.com. There’s undeniably some overlap between those two audiences, but the sites serve different functions.
For instance, many people who visit NeilPatel.com are interested in the latest article, podcast, or video. They want to consume information.
They often visit the blog immediately or click on the link to the blog to go there right away.
Those who visit Crazy Egg might also want information since we publish a prolific blog with interesting content related to website optimization.
However, they might also be interested in website click tracking tools, heatmaps, and other user behavior reports. Maybe a friend has referred them and recommended our service.
If I know where people are clicking on my sites, I can optimize each one for conversions. Plus, I know which pages deserve most of my effort.
I recently wrote a post about my website traffic and the number of posts I’ve published. Nearly 50 percent of my traffic comes from my top 50 pages, and a ton of my traffic comes from the top 10.
Combining this information with a website click tracking tool would allow me to optimize the most-trafficked pages for optimum performance.
Start Using Crazy Egg to See What’s Working and What’s Not
Now that you understand how a website tracking tool can improve your relationship with your audience — and anticipate their needs — use Crazy Egg to figure out what’s working on your website and what could use improvement.
The more data you collect, the more you can improve the user experience.
Conclusion
A website click tracking tool helps provide valuable insights into how your visitors behave.
Exploring user behavior can tell you whether visitors understand how to navigate your site, whether they’re attracted to your CTAs, and if they scroll down to view more of your content.
You can also gain deeper insights into metrics you might be tracking, such as bounce rate and time on page.
Consider running user behavior reports with a website click tracking tool on multiple pages. Single out the ones that get the most traffic or that contribute the most to conversions.
Before you know it, you’ll have turned your website into a lead generation machine.


