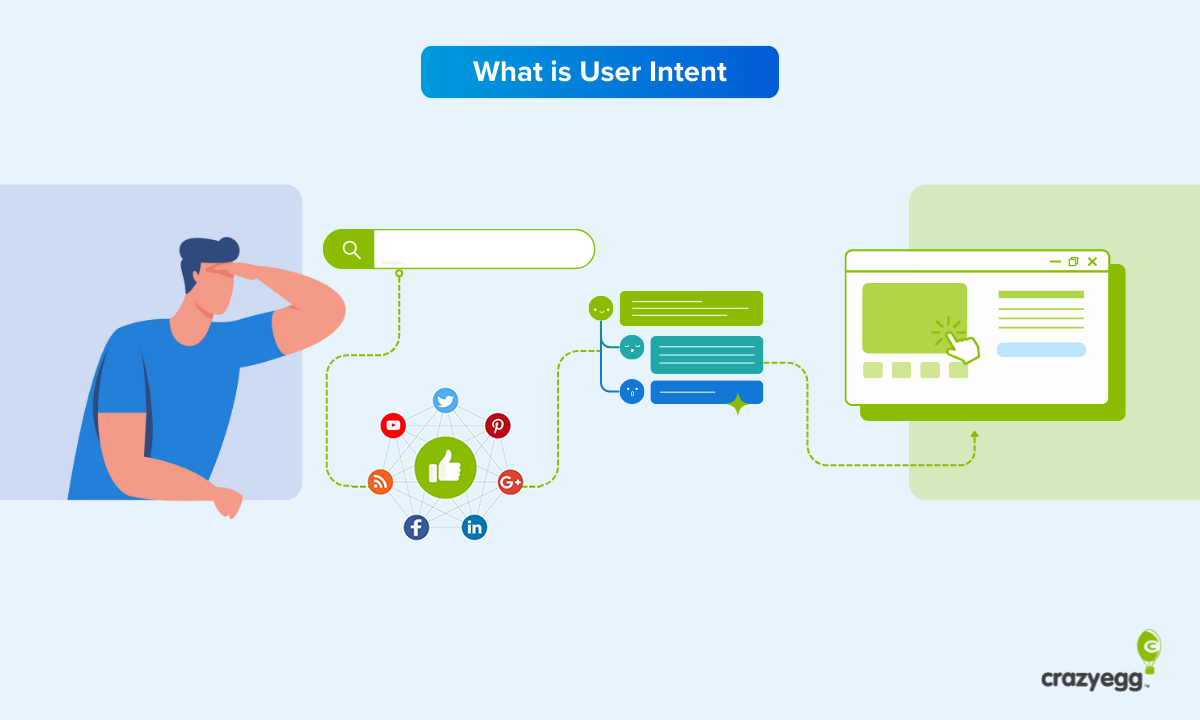
User experience (UX) analytics is the process of tracking, analyzing, and interpreting how users interact with your product or service (like a website or an app) to determine its usability and long-term viability.
There’s typically a lot of user activity to track on a site, including clicks, navigation, engagement, and conversions, which can make the analytics process overwhelming even for experienced web marketers.
There are “priority user behaviors” that take precedence over less important metrics. If you can hit these benchmarks, you have exceptional UX.
1. One-second page load time
Page load time is the duration it takes for a web page to load in a user’s browser, measured from the initial request to the final rendering/display of all elements on the page. However, page load time doesn’t measure requests that happen after the initial rendering is complete, such as fetch requests or asynchronous scripts. Once users start interacting with a fully loaded page, this is where the page load time measurement ends.
Longer page load times (more than three seconds) negatively impact the user experience. People today simply don’t have the patience to wait, as they expect pages to load instantly. That negatively affects your bounce rate and, by extension, the overall traffic you get to your site.
A famous Amazon-related study by Greg Linden seems to corroborate this claim. In 2006, he found that for every 100ms added to its page load time, Amazon was losing 1% in sales. This would’ve cost Amazon $107M back then. Considering its annual revenue, Amazon would’ve been losing around $3.8B today for every 1/10 of a second added to its page load time!
It makes perfect sense when you think about it. If users can’t get to their intended destination quickly, they get frustrated and abandon their carts, close the page, or quit your website. And your conversions go down as a result.
Today’s average page load time varies by source, but the general consensus is around three seconds. Achieving a one-second page load times will get you one step closer to a superior UX.
2. Between 30%-50% returning visitors and 50%-70% new visitors
New visitors refers to the percentage of users who have never interacted with your site before and are now landing on one of your pages for the first time.
Returning visitors is the percentage of users who have visited your site before and are now landing on one of your pages again. Both metrics can be accessed in Google Analytics 4 (GA4), and are typically measured over a certain date range.
Many webmasters focus primarily on attracting new visitors consistently. But, returning visitors are not only more likely to be your best customers, but they also speak volumes to the quality of your UX. People come back to a site when they have confidence in your brand and can access the things they’re looking for with ease. Put differently, they have an outstanding user experience.
The rule here is simple. You never want to tip the scales in either direction, i.e., to have 100% new visitors or 100% returning ones. On average, sites operate with 30% returning visitors and 70% new visitors. Aim for 50% new visitors and 50% returning visitors on average to achieve the ideal mix of traffic for a comparatively excellent UX.
3. Session length over four minutes
Session length or session duration refers to the average time a user spends on a website, app, or platform during a single visit. It’s calculated by dividing the added length of all sessions by the total number of sessions over a specified timeframe.
Above-average session length (higher is better) is usually an indicator of a streamlined user experience. The longer someone stays on your site, the more opportunities they’ll have to convert. It also suggests that visitors found your content useful, discovered the products they wanted, and located the resources they needed without any major issues or disruptions.
However, session length should be looked at in conjunction with other metrics, like your bounce rate, to get a more comprehensive overview of your site’s overall UX performance. For example, a news outlet might have a lower session length than something like an ecommerce website, but also a lower bounce rate.
On the flip side, an ecommerce shop might reveal both a longer session length and a higher bounce rate. These findings don’t mean that one is better than the other. It simply means that both the news outlet and the ecommerce shop are performing within the expectations of their respective niches.
At any rate, the average session length for websites clocks in at between two and four minutes. If users are spending an average of over four minutes on your site in a single visit, it’s safe to assume you have a top-tier UX.
4. A 40% or lower bounce rate
In web analytics, bounce rate is the percentage of people who come to your website and leave without interacting with it, usually because they couldn’t find what they were looking for, your call to action prompts (CTAs) aren’t well optimized, or you aren’t matching your core audience’s search intent. It’s calculated by dividing the number of single-page sessions, or users who leave your site after interacting with only one page, by the number of total site sessions over a specific period.
You can also think of the bounce rate as the opposite of the engagement rate in GA4. For example, a bounce rate of 60% should result in an engagement rate of 40%, which you don’t want. When users stay on your site, click on your links, and read your articles, this could be summarized as a good user experience. When users don’t engage with your site, it means you’re serving them content they don’t want and products or services they don’t need.
The average bounce rate varies over different industries, but most sites have between a 40% and a 55% bounce rate. Managing to get your bounce rate below 40% puts your UX well above your competitors on most fronts.
5. Conversion rate higher than 5%
Conversion rate refers to the number of visitors who successfully perform a desired action on your website, like downloading an ebook, subscribing to a course, or buying a product. It’s calculated by dividing the total number of conversions by the total number of site visitors, typically expressed as a percentage. The concept of optimizing this metric is called conversion rate optimization (CRO).
There are a number of factors that can affect your site’s conversion rate, including the type of different channels that source traffic to your site, your audience’s search intent, your products’ prices, and the percentage of your returning customers. For example, if your business is centered on selling $2,500 luxury bags, your site will have a lower conversion rate than an e-shop selling $50 cat treats.
Nonetheless, an objectively high conversion rate is a reflection of an enjoyable user experience for customers. They’re finding what they need, your website’s value proposition is clear, the shopping process is frictionless, and the incentive to complete a purchase is compelling. But this doesn’t mean that you can’t turn an acceptable conversion rate into an extraordinary one.
The average conversion rate for websites across multiple industries swings between 2% and 5%. Strive for a conversion rate above 5% to position your site’s UX among the best in your field.
6. Error rate less than 1%
Error rate represents the number of errors that users encounter on a site, usually when trying to start an activity, work through a process, or complete a task. It’s calculated by dividing the number of requests that return an error code by the total number of requests on a website over a specified timeframe, shown as a percentage.
A high error rate can be traced back to server problems or conflicts with your hosting provider, or it might reveal a bigger underlying issue with your site’s structure and inconsistencies within its code. In extreme cases, this scenario could take down your entire site, so there won’t be any UX for people to critique or appreciate.
Many sites have an error rate between 5% and 10%, but this is considered borderline unacceptable by today’s standards. Keep your error rate below 1% to preserve user loyalty and maintain a high-level UX.
7. An 80% or higher completion rate
Completion rate is a frequently overlooked metric that makes a big difference in how users perceive your UX. It shows the percentage of visitors who successfully complete a desired action on your site. It also indirectly measures how effective, intuitive, and user-friendly your website’s self-service items are, such as FAQs, guides, reports, and help articles.
On the web, the user experience’s quality is highly dependent on how easy it is for users to complete their individual actions or multiple desired actions in a row. Being able to successfully move from one funnel to another, change pages, or find helpful content without the intermittent hitch boggling down the journey results in a streamlined and exceptional UX.
An important distinction to make is the difference between completion rate and conversion rate, two different metrics that share some of the same commonalities. Conversion rate measures the percentage of customers who have purchased one or more products out of the total number of customers who viewed the products.
Completion rate is the percentage of customers who have completed the purchase out of all the customers who added the item or items to their cart.
Modern websites have an average task completion rate of 78%. So, anything above 80% guarantees your site a spot in the best-in-class UX club.
8. An average time spent on page of 1 minute
Average Time on Page (replaced by Average Engagement Time in GA4) is a pretty self-explanatory metric. It denotes the average time a visitor spends on a site’s page. Average Time on Page is calculated by dividing the total amount of time users spend on a page by the total number of page views minus the number of page exits.
For example, if most visitors who land on your site spend 30 seconds viewing your About Us page, then your About Us page’s average time on page is about 30 seconds.
Ideally, you want visitors to spend as much time as possible on your most popular website’s pages to interact and engage with your content. This demonstrates they’ve found those pages valuable and useful, increasing the chances of users returning to your site in a future browsing session.
On average, users spend about 40 seconds on a page. Achieving a 60-second average time spent on page puts your UX at the summit of its game.


