Qualitative data is descriptive information that numbers can’t quantify. This type of data helps us explore concepts, behaviors, emotions, and social phenomena. These are all things you can’t easily measure, which can make them challenging to study.
Researchers have reliable ways to slice, dice, and interpret qualitative data to get the most helpful results possible.
How Qualitative Data Differs from Quantitative Data
If you’re struggling to detangle the difference between qualitative and quantitative data, I totally get it. The words are way too similar.
Think of it this way: quantitative data is all about numbers and statistics. It helps us understand the “how many” of a question.
For instance, if you want to know how many people purchased a product last month, quantitative data will give you a clear, numerical answer. Quantitative data quantifies information.
Examples of quantitative data include:
- Statistics: The average test score in a class is 85%.
- Percentages: 60% of respondents prefer brand A over brand B.
- Frequencies: 30 people attended the event.
- Measurements: The tree is 15 feet tall.
- Numerical counts: 500 products were sold last week.
Qualitative data, on the other hand, digs deeper into the why and how behind those numbers.
For example, say you want to understand why customers are choosing your product over a competitor’s.
Numbers won’t tell you the “why.” So you turn to qualitative insights gathered from interviews, reviews, and open-ended surveys. This data will give you the quality—the meaty reasoning—behind the numbers.
Examples of quantitative data include:
- Interview responses: A customer says, “I love how easy it is to use this product.”
- Open-ended survey answers: In a survey, someone writes, “The customer service from Martin was very helpful and friendly.”
- Descriptions: Describing a city as “deliciously gloomy and moody, yet cozy if you venture inside one of its signature cafés.”
- Observations: Noticing that students seem more engaged during hands-on activities in the classroom after they’ve had a longer recess than normal.
- Themes or patterns: In interviews, many employees mention feeling “overwhelmed” and “defeated” by the workload.
Dig deeper into these differences in our guide to telling qualitative and quantitative data apart.
Examples of Qualitative Data
Ok, so we have a clearer understanding of what separates qualitative and quantitative data. Now let’s explore where you can find qualitative data:
- The FBI Freedom of Information Act (FOIA) Vault and other government sources, like the Library of Congress’s digital catalog
- Social media posts and comments on sites like Reddit, Quora, Facebook, and YouTube
- Responses to market research surveys—those you run yourself and those others have run
- News articles (and the comments sections below them!)
- Scholarly and scientific research from databases like Google Scholar, the National Library of Medicine, and Frontiers
- Photos, videos, and audio files–including things like songs and podcasts
Each of the qualitative data types has different strengths and weaknesses. Peer-reviewed scholarly and scientific research offers an objective and factual look at a topic with bits of analysis sprinkled in.
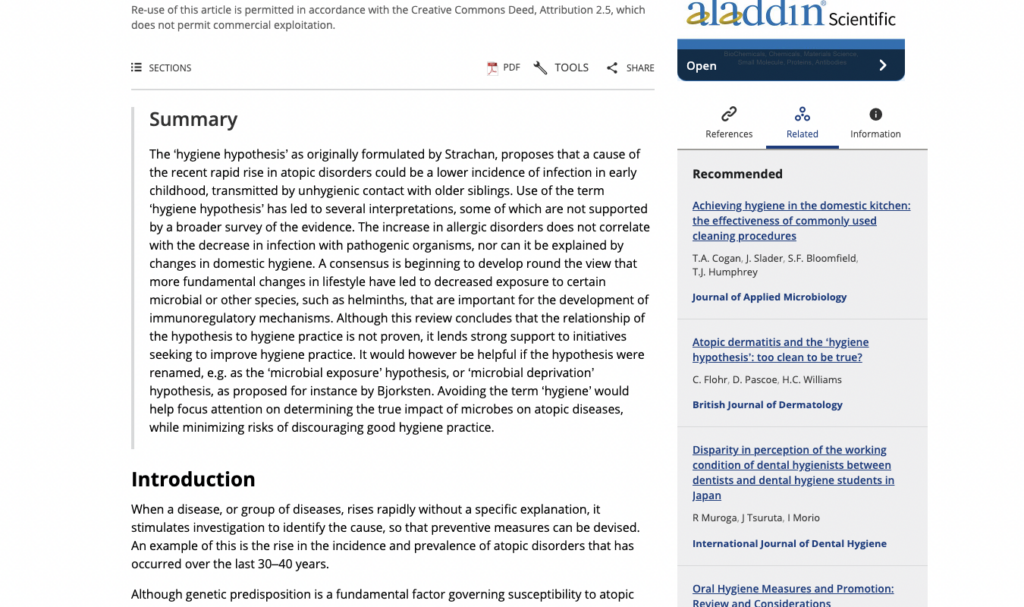
This abstract from a piece in Clinical and Experimental Allergy, for instance, summarizes hard, cold research about the impact of cleaning on asthma and allergies. But it also includes subjective analysis from the authors—like that using a term other than “hygiene” is helpful when it comes to describing the impact of germs on atopic diseases (aka, allergies).
The comments section of a Reddit post, on the other hand, is completely subjective and speculative. It’s difficult, if not impossible, to verify any information shared in such a post.
Take r/Tulpas, for example. The subreddit—which has 50,000 members—is dedicated to people who use their imagination to create “intelligent companions” with their own thoughts and motivations.
These creatures, if you will, are called tulpas.
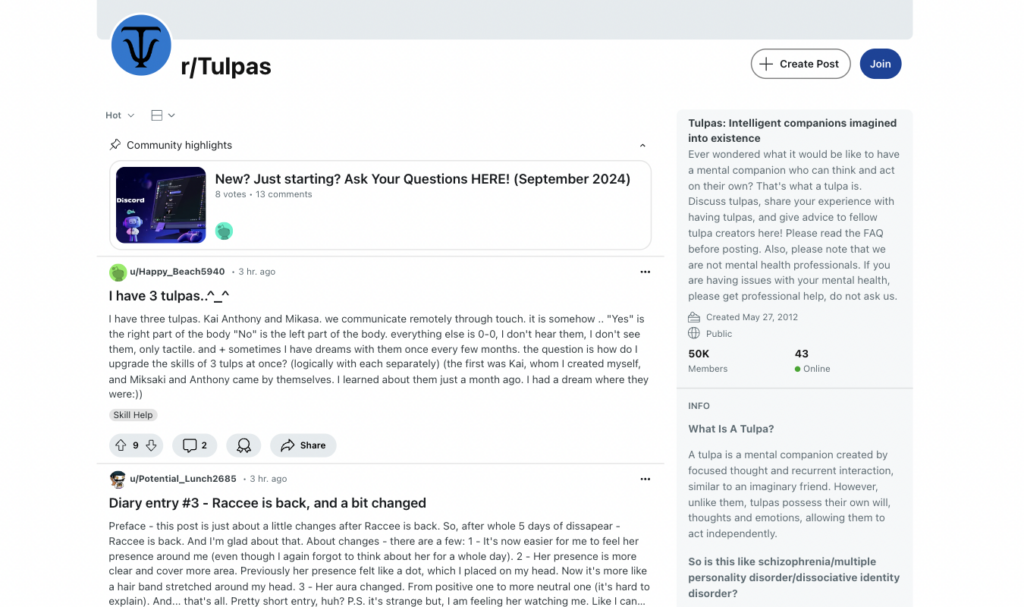
It’s a fascinating subreddit with lots of information—but it’s up to the reader to decide whether that information is true. Or whether the people who have tulpas genuinely believe in them.
To help balance your information out, don’t look for just one type of qualitative data and then move on to collecting, coding, and analyzing it. Collect your information from at least two totally different places. Combine a more scientific type of data, like a scholarly article, with comments from Reddit, for example.
And yes, there is scholarly research on tulpas. Sort of.
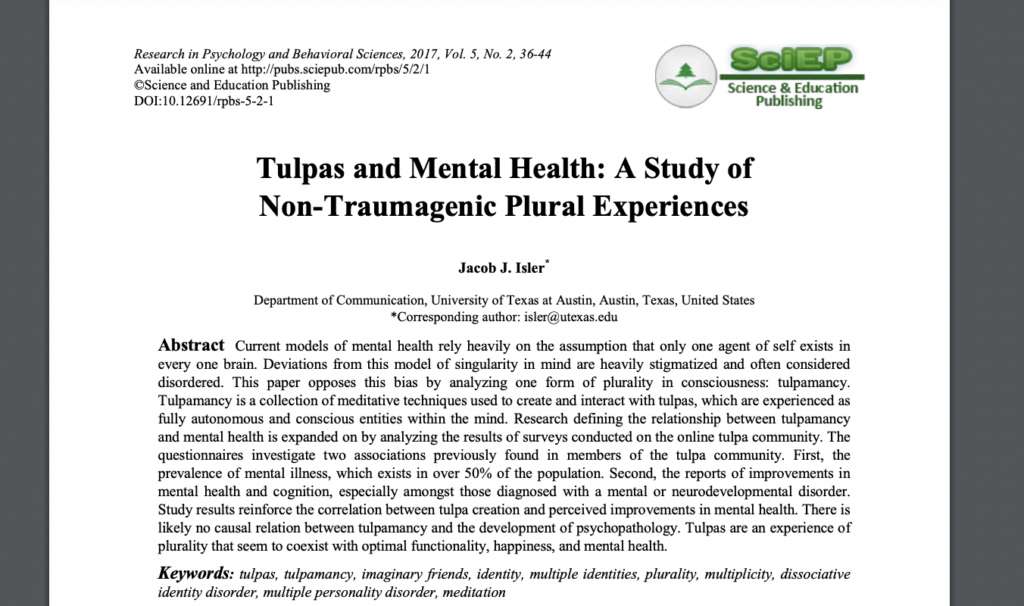
At face value, this piece, which I found via Google Scholar, looks legit.
According to the author, his study found no apparent causation between creating tulpas—known as tulpamancy—and poor mental health. The author suggests there might even be a positive correlation between the two. As in, tulpamancy might coincide with an increase in mental wellness.
The mixed-method (aka both qualitative and quantitative) study asked registered users of four online tulpa communities—including r/Tulpas on Reddit, although this community was ultimately not included in the survey due to the anonymous, and therefore unverifiable, nature of the members—to answer 58 closed-ended questions about tulpamancy.
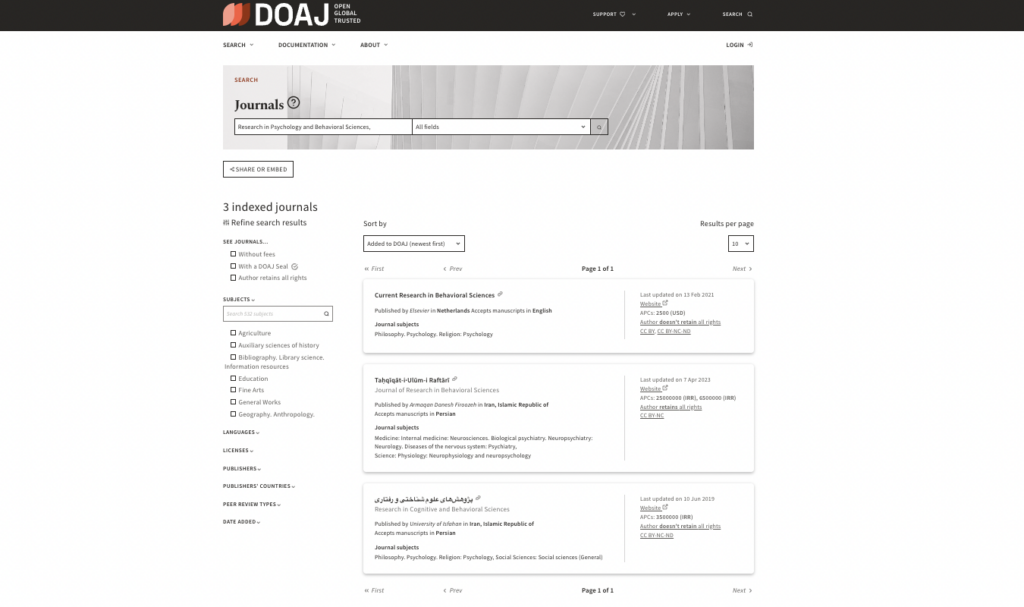
But here’s the thing: it was published in Research in Psychology and Behavioral Sciences, an open-access journal put out by Science and Education Publishing. In my quest to verify the origins of the paper, I realized I couldn’t find anything about the journal online, other than reports that it might be “predatory.”
So I searched for it in the Directory of Open Access Journals (DOAJ), a nonprofit, independent organization with strict criteria for defining what a trustworthy open-access journal looks like.
Basically, DOAJ is the gold standard for deciding whether to trust an open-access publication.
Turns out our old friend Research in Psychology and Behavioral Sciences isn’t in the DOAJ index.
So does this mean we should throw Isler’s research on tulpas out the window?
Not necessarily. It just means there’s no verification that the research is actually peer-reviewed.
If you were gathering qualitative data on tulpas, I’d suggest:
- Observing conversations on Reddit and the other tulpa communities listed in Isler’s research
- Reading Isler’s study, along with his analysis of the results
- Conducting your own, similar tulpa research, perhaps including more open-ended vs. closed-ended questions
- Looking for more tulpa research in journals listed in the DOAJ directory
This is how you gather a well-rounded pool of qualitative data to analyze and draw insights from.
Read this post on qualitative data examples for more weird and interesting examples of where to find the good stuff.
Methods for Collecting Qualitative Data
There are four core ways to collect qualitative data: interviews, focus groups, observations, and open-ended surveys.
Let’s go through the pros and cons of each one—and when you should (and shouldn’t) use them.
Interviews are structured or semi-structured conversations between a researcher and a participant. The interviewer guides the discussion with predetermined questions, but there’s room for tangents.
Say you’re researching what it’s like for patients to live with chronic illness. You might ask a question like, “How does your condition affect your daily life?” The patient might offer concrete details and share emotional stories about family support. Or their relationship with healthcare providers.
Interviews are great for flexibility, depth, and the type of rich insights you might get from a lively conversation around a dinner table. They’re not ideal if you’re short on time or resources and you need to gather qualitative data from a lot of people, and quickly.
Focus groups are like interviews, but they add the unpredictability of a social setting. The role of the researcher is to observe a small group of people as they grapple with a specific discussion or research topic.
A moderator guides the conversation, and a skilled one will make sure every participant feels safe to share their true feelings. But social dynamics are powerful, and they might make it hard for some people to share their feelings openly.
Because of that, focus groups are best for when you’re in the earlier stages of research and want to narrow your focus from broad questions to a specific one.
The goal of observation is to watch natural behaviors happen in real-world settings without researcher interference. Going to a grocery store to observe which aisle shoppers go to first and what the journey looks like after that, for instance. Or observing employee behaviors in an office setting versus a construction site.
Observations are the way to collect data that shows peoples’ genuine actions. Especially when you don’t want their perspectives about themselves to influence their behaviors.
That said, observations don’t really explain why people do what they do. They’re best paired with follow-up interviews or surveys to help flesh out that side of the story.
Finally, open-ended surveys and questionnaires provide you with written answers to preset questions. It’s easy to send out surveys to hundreds of people, so if you need a lot of data quickly, surveys are ideal. But they don’t allow for tangents or the objectivity of observations. There’s also no social dynamic factor.
When you need a large sample size, though, you really can’t beat surveys.
With all the different strengths and weaknesses, it can be hard to pick the right method. Our guide to data collection methods can help.
Coding Qualitative Data
Qualitative data coding is a fancy term for the process of organizing descriptive data. It’s a way of quantifying the subjective—aka, turning it into something measurable. How? By categorizing the insights, patterns, and themes in your research according to a specific framework.
There are four main types, or frameworks, of qualitative data coding: deductive, inductive, axial, and selective coding. Each one does something different when you’re analyzing qualitative data.
Deductive coding is a top-down approach. You start out with predetermined codes based on their research questions or themes. For example, in a study on the outcomes of university students, your codes might include things like “study habits,” “friends,” or “career goals.”
As you go through the data, you can apply these codes to relevant sections. This creates a nice little map of the data, which you can then use to spot patterns that relate to specific themes.
Inductive coding, on the other hand, is a bottom-up approach. Instead of starting with predefined codes, you allow codes to rise up from the data. This method is super useful when you don’t want to bring biases or assumptions into the analysis. Or, since that can be almost impossible, when you want to greatly reduce the biases and assumptions.
You might start reading interview transcripts and notice themes that pop up over and over. In our mock study on university students, you might see themes like “peer relationships,” “group study,” or “family support.” These then become the codes for analysis.
Axial coding is used after inductive or deductive coding. The goal here is to identify relationships between the different codes. You can use axial coding to group categories and subcategories together.
This helps you see how different themes relate to each other. For instance, in the university student example, you might figure out that “level of family support” and “success in classes” are linked to each other.
Finally, selective coding focuses on developing a core theory or theme from the data. This step synthesizes everything you identified during open and axial coding into a central idea.
This core idea, then, ties all categories together. For example, your theory might be: “Strong family support improves educational outcomes among university students.”
Each subcategory would then contribute to this conclusion. The goal of selective coding is to transform raw qualitative data into theories or insights you can act on.
Learn more about how to do this—including straightforward tips and examples—in our guide to coding your qualitative data.
Analyzing Your Qualitative Data
You’ve collected and coded your data. Now it’s time to analyze it so you can draw out those concrete, actionable insights.
Throughout my extensive research on qualitative data, I’ve identified five main ways to do qualitative data analysis:
- Content analysis: Involves combing through text-based data to identify certain keywords and patterns. Best used with written data like interview and focus group transcripts, survey answers, and journal articles.
- Narrative analysis: Process of studying personal accounts, anecdotes, and stories to understand individual experiences. Best used to analyze customer reviews, interviews, or testimonials.
- Discourse analysis: Studies how people manipulate language to convey meaning and shape perceptions. Useful when applied to political speeches, media outlets, and company communications to see how language choices influence opinions and behaviors.
- Thematic analysis: Identifies key themes or ideas that emerge from qualitative data, usually things like survey responses or interview transcripts. Useful in early-stage research when you’re exploring a new topic without a specific hypothesis.
- Grounded theory: Focuses on generating new theories from the data itself, rather than the other way around. Especially valuable when there’s little prior research on a topic.
So should you pick just one of these methods and go with it?
Probably not. Different methods will serve your research in different ways. Content analysis will help reveal surface-level patterns, while narrative analysis will help you dig deeper into what lies beneath the most and least common keywords. Grounded theory is helpful if you want to go into a study with as little preconceived bias as possible.
And so on.
For more support on which analysis methods to use and when, check out our post on when to use each qualitative data analysis method.
How to Know When You’ve Reached Data Saturation
There’s something addictive about collecting data. Especially when you’re reeling in the good stuff. Each insightful piece of text or show-stopping interview makes you want more.
But there comes a point where you’ll stop getting those bursts of new information. It’s called data saturation, and knowing when you’ve hit it is crucial to saving yourself time, energy, and money.
I like to think of data saturation as existing on a spectrum. On one end, you’ve got just enough data to pinpoint interesting themes and patterns. At the other end, you’ve got so much data that everything new that comes in only reinforces what you’ve already collected.
If you go much beyond that point, you’ll waste time. End of story.
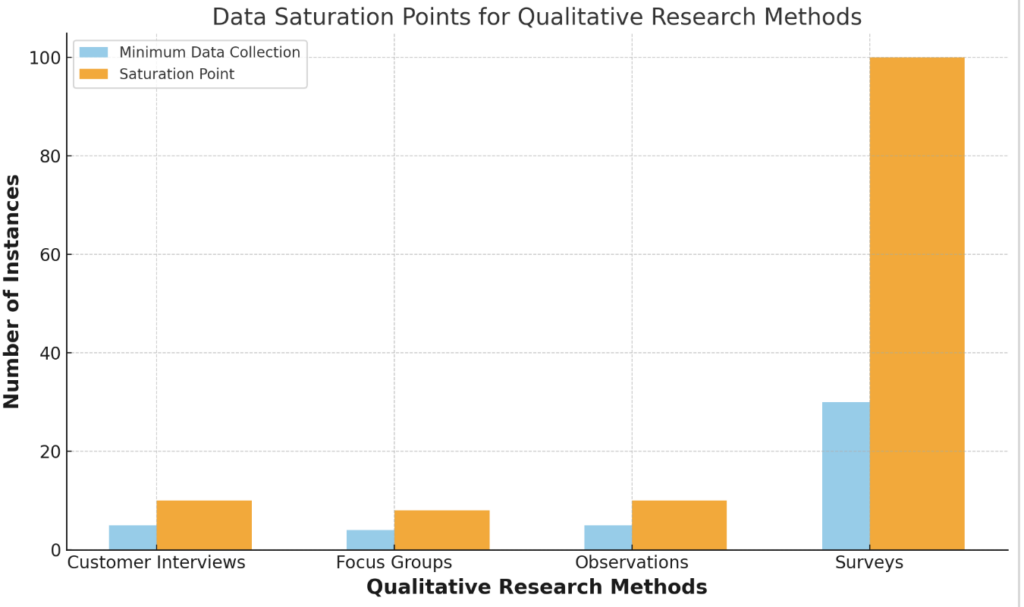
I’ve also figured out what the two ends of the spectrum are for interviews, focus groups, observations, and surveys. As in, the range of data you should hold for each one to stay within the ideal saturation lines:
- Interviews: Core themes appear after at least 5 interviews, data saturation occurs at 10
- Focus groups: Anything between 4 to 8 sessions will give you all the data you need
- Observations: Patterns will emerge and peak at between 5 and 10 observation sessions
- Surveys: Get good insights with at least 30 responses, reach saturation at 100
Here’s a visual to give you a quick guide to reference.
You’ll learn even more about the signs of saturation to watch out for in our post on the four signs of saturation in qualitative research.
How to Triangulate Data in Qualitative Research
Data triangulation is another fancy term, but don’t let it confuse you. All it means is the process of viewing data from multiple angles. Consider the three points of a triangle as representing three separate lenses through which to view your data, which sits in the middle of the three points.
But as with everything in qualitative data, it’s not quite that simple. There are a few different ways to triangulate data in qualitative research.
First, there’s method triangulation. This approach uses different qualitative data collection methods—like focus groups and interviews—to explore the same topic. If you’re following our advice to use more than one data collection method, congratulations! You’re already doing data triangulation.
Second, you’ve got investigator triangulation. Your goal with this is to have more than one person analyze the same set of data. It’s essentially a way to peer-review the data to check for biases, inconsistencies, and the like.
Then there’s theory triangulation. Here, you use different theories to study the same dataset or topic. Let’s go back to the lens comparison. Think of each theory as a different pair of glasses. You’ve got the results of a survey in front of you. First, you analyze the results through the first theory/pair of glasses. Then you do it again with the second theory/pair of glasses. And so on.
Finally, data source triangulation is just the process of gathering data from more than one source. It’s just like method triangulation, except that instead of using more than one method, you’re using more than one source.
Learn more about the benefits of each method, plus when to use each, in our guide to using data triangulation in qualitative research.


