With the shaky transition from Universal Analytics (GA3) to Google Analytics 4 (GA4) in July 2024, users have grown increasingly dissatisfied with GA4’s features, its UI, and the tool’s general approach to data analytics. As a result, people are becoming more open to exploring alternatives sooner rather than later.
In fact, before GA4 took over, Google’s faithful would shrug off any criticism about the web analytics platform and look at you funny if you used a different analytics tool. Now, however, even the staunchest GA3 defenders are super curious to try out a legitimate alternative to the universally disliked GA4.
We’ve included Google Analytics 4 alternatives that can COMPLETELY replace GA so you can stop using GA4 for good..
1. Clicky

Pricing:
- Limited Free plan indefinitely or 21-day Pro Premium plan for free
- Pro Platinum plan for up to $159.99/month
What I personally LIKE about Clicky:
- Simple and user-friendly UI
- Intuitive navigation
- Straightforward installation
- Live data monitoring features
- Fast loading
- Streamlined reporting
- Works well with WordPress sites
What I personally DISLIKE about Clicky:
- Questionable pricing tiers
- Some UI elements can be hard to find within the uninspiring color scheme
- Enterprise-level organizations might find it too basic for their web analytics needs
Clicky is an entry-level web analytics tool that offers incoming web traffic analysis in real-time. While not nearly as comprehensive as GA4, Clicky is far simpler to implement and easier to understand—both for seasoned data analytics professionals and novice marketers alike.
The tool offers three methods to connect it to your site, including:
- Standard tracking code
- Asynchronous tracking code
- Non-JavaScript tracking code
Additionally, you can install Clicky automatically, by using one of its many apps and plugins, and manually, or by pasting your Clicky tracking code in your site’s HTML.
Clicky boasts a very simple UI, which might turn off some customers because of its outdated visual design. However, beneath its simplistic appearance, it offers robust tracking capabilities to adequately address most of your requirements—most of the time.
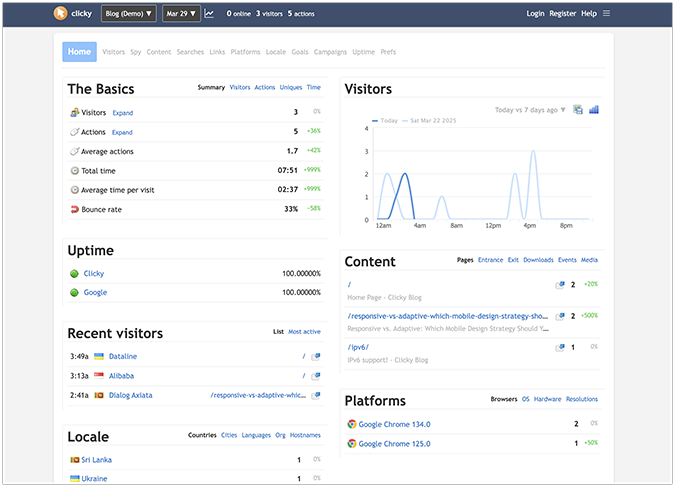
Here’s a quick rundown of Clicky’s user interface:
- Home—provides the main overview for everything happening on your site traffic-wise.
- Visitors—shows a comprehensive representation of all users who land on and engage with your site; you can parse this by user engagement, user engagement time, and traffic sources.
- Spy—offers a visual illustration of all users who land on your site, including their IP addresses, cities, and referrers in real-time.
- Content—shows the top-performing pages on your site.
- Searches—offers insights into how users are finding your business on the web; because of the Google secure search update, this column will mostly show private searches.
- Links—shows all links coming to and going out from your site.
- Platforms—shows all the platforms, devices, and operating systems your site is being accessed from.
- Locale—shows all the countries where your visitors are coming from.
- Goals—this section allows you to set up your goals and track their performance over time.
- Campaigns—this section allows you to create and track your campaigns’ performance over time.
- Uptime—monitors and reports if your site is experiencing any downtime.
- Prefs (preferences)—allows you to set up and change your account options.
Ultimately, Clicky’s ideal user base includes entry-level marketers, small to medium-size blog owners, and SEO professionals looking for a straightforward analytics tool that is easy to access and requires minimal setup or troubleshooting.
2. Pirsch

Pricing:
- 30-day free trial plan
- Up to $12/month for the Plus plan
What I personally LIKE about Pirsch:
- Slick and modern design
- Affordable pricing tiers
- Lightweight
- Easy to implement
- Privacy-friendly
- Detailed filtering options
What I personally DISLIKE about Pirsch:
- Heatmaps are unavailable to use
- The availability of multiple different versions of the same Pirsch analytics tool may confuse first-time users
Pirsch is a lightweight web analytics tool with a focus on speed, reliability, and cost-effectiveness. It features a limited open-source version on GitHub, and a paid version available from the official Pirsch website.
The marketing analytics tool has two main selling points: first, it’s fully GDPR-, CCPA-, ePrivacy-, PECR-, and Schrems II compliant, so it doesn’t require a cookie banner consent to handle and store your data (you retain full ownership of your site analytics data).
Second, it offers a wide range of website, server-side, software development kits (SDKs), and RESTful API integrations, ensuring seamless data collection optimized for your goals and requirements.
Pirsch’s main functionalities include:
- Dashboard—displays the main data cards for integral metrics, such as pages, referrers, countries, and events.
- Funnels—allows access to all site funnels, including their names, conversion rate, number of visitors, and abandonment rate (labeled as “dropped”).
- Sessions—shows all web traffic essentials, such as unique visitors, page views, sessions, bounce rate, and session duration.
- Links—displays links from external sources like your social media accounts that lead back to one of your pages.
- Filter—a comprehensive filter that allows you to sort incoming traffic by entry or exit page, referrer, channel, country, region, language, or OS.
- Views—an additional one-click filter that sorts traffic by signups, registrations, or search engines.
Overall, Pirsch is the perfect choice for web professionals looking for a fast and simple setup without giving up on critical features like filters, site entry points, privacy-compliant analytics, and cookieless opt-ins. It’s also a viable alternative for price-sensitive users who want to avoid the hassle of setting up GA4.
3. Crazy Egg Analytics

Pricing:
- Free 30-day trial you can cancel at any time
- Up to $499/month for an enterprise-level solution
What I personally LIKE about Crazy Egg Analytics:
- Best-in-class heatmap tool
- Unlimited surveys and responses
- Very easy to install, configure, and run
- Video recording tool provides detailed insights into user behavior
- Reliable A/B testing feature rounds out one of the most comprehensive analytics platforms on the market
What I personally DISLIKE about Crazy Egg Analytics:
- You have to sign up to try out the free trial
- The Starter and Plus plans offer a limited number of recordings and recordings storage
Crazy Egg Analytics is a powerful, all-encompassing web analytics tool that offers heatmaps, A/B testing, surveys, user recordings, and a modern WYSIWYG editor in a single package. It’s one of the most comprehensive analytics solutions on the market, offering a robust set of functionalities to track how users interact with your site and make informed adjustments based on a combination of visual and numerical data.
It takes 5 minutes to install Crazy Egg Analytics on your site. Here’s how to set it up:
- Create an account by choosing your preferred plan
- Follow the onboarding flow to get your tracking code
- Paste the tracking code in your site’s HTML
- Check if the tool is properly integrated with your website
Once the installation is successful, you can navigate to your new Crazy Egg account. Here, you will be presented with the following features found on the left-hand side of the main dashboard:
- Live activity—tracks the current activity of all users interacting with your pages as they happen.
- Goals—an area where you can configure on-site actions you deem valuable, including the total number of clicked links, the number of completed form submissions, and the number of page views.
- Snapshots—shows the number of unique visits arranged according to desktop, tablet, and mobile devices.
- Recordings—provides access to all collected recordings of visitor activity.
- Errors—tracks errors that might appear on your site.
- Traffic—displays the incoming traffic to your site.
- A/B testing—a section where you can create, configure, and run A/B tests.
- Surveys—a section where you can create surveys from scratch, or use an existing template to run a new survey.
- CTAs—enables the deployment of customizable banners, popup buttons, and CTAs on specific pages without changing the original page design.
The Crazy Egg Analytics tool is the ideal pick for two distinct customer groups: beginners in web analytics and experienced users who prefer a visual representation of how inbound visitors click, scroll, and generally interact with the pages on your site. Its four pricing tiers are suitable for companies of all structures, sizes, and number of employees—as well as for individual site owners.
4. Quantcast

Pricing:
- Quantcast Measure—a free version of the Quantcast platform that provides complete audience analytics, including geographic profiles and competitor data
- Quantcast Advertise—a premium version of the Quantcast platform, with a fee structure based on different use cases such as management, media, and non-media paid advertising campaigns and analytics
What I personally LIKE about Quantcast:
- State-of-the-art programmatic advertising solutions
- Sophisticated targeting capabilities
- Comprehensive reporting features
- Quick campaign setups
- Responsive customer support
What I personally DISLIKE about Quantcast:
- The unclear distinction between Quantcast’s two different tools (Quantcast Measure and Quantcast Advertise) creates unnecessary confusion for new users
- Missing features such as third-party audience segments (3DP), digital out-of-home advertising (DOOH), and subscription video-on-demand (SVOD) tracking models make the platform feel incomplete
Quantcast is a web analytics tool specializing in real-time audience insights, AI-powered programmatic advertising, and campaign measurement. It offers a variety of specific features to better understand how audiences use your site across different platforms, OSs, and devices.
The platform offers two distinct tools: Quantcast Measure and Quantcast Advertise.
Quantcast Measure is available for free, offering detailed demographic and geographic insights for your online properties and mobile applications. A small taste of the tool’s full capabilities includes breaking down audience demographics according to age, income, education, and political engagement. All data collected by Quantcast about your businesses can be published online, enabling interested parties to consult it for future use.
Quantcast offers three types of accounts: Marketer Accounts, Publisher Organizations, and Quantcast Measure/Choice accounts. The features available in Quantcast will vary based on your subscription model, your role within an organization, the products you have access to, and your assigned permissions.
For example, Marketer Accounts users can access the following features: Ads Manager, Audiences, Assets, Organizations Manager, and Information.

Users of Publisher Organizations can work with Audiences, Organizations Manager, Privacy, and Information.

Quantcast Measure/Choice users are limited to Audiences, Organization Manager, Privacy, and Information.

All things considered, Quantcast is an ideal solution for advertisers and publishers looking to generate, analyze, and export sizable quantities of data for ongoing and upcoming advertising campaigns.
5. Fathom Analytics

Pricing:
- Credit card information required to access a free 30-day trial
- Premium accounts start at $15/month and are later billed based on a monthly data point volume (includes pageviews and events)
What I personally LIKE about Fathom Analytics:
- Modern, simple, and intuitive UI
- It can be set up in minutes
- Sources more accurate data than GA4, blocking bots, scrapers, and spam traffic
- 100% Cookieless (no cookie banner consent required)
- Privacy-focused
- Fully GDPR-compliant
What I personally DISLIKE about Fathom Analytics:
- You can’t migrate events
- Not as many features compared to some of its competitors
- Limited discounts for yearly subscription plans
Fathom Analytics is a lightweight and user-friendly analytics tool, specifically designed to replace the needless complexity of GA4 with a streamlined UI within all facets of its main design philosophy. It offers all the essential tracking metrics, such as the current number of active users, the total number of users and the total number of page views over a given timeframe, the average time on site, the average bounce rate, and the total number of event completions.
The platform’s key strengths materialize themselves in two general use cases:
- Its ability to import historical data from GA4 and preserve tactics and strategies from previous campaigns
- Its real-time data monitoring feature, coupled with a customizable dashboard that allows customers to receive insights from multiple URLs at the same time
Fathom’s integrations are powered by a single line of code. Plus, the tool is compatible with most popular website builders, frameworks, and CMSs. These two facts make Fathom Analytics the go-to solution for people who want to maximize their SEO gains without allocating a fair number of resources to performing technical optimization.
In conclusion, Fathom Analytics is an optimal choice for a wide range of users such as small blog owners, medium businesses, and online shops, who value privacy and aim to minimize the intrusive nature of data tracking for their customers.