Clicky is a privacy-oriented, GDPR-compliant, and easy-to-use web analytics platform, built to circumvent a needlessly growing complexity in favor of a more streamlined approach to real-time website traffic and user behavior analytics.
Is Clicky Analytics a Viable GA4 Alternative?
Clicky Analytics is one of the first GA alternatives on the market, making the software an instant hit when it came out back in 2006.
Today, however, it seems like Clicky’s developers (spearheaded by an individual contributor named Sean Hammons) are making sporadic, core-level updates once every year.
For instance, their last update was back in January 2024, when they introduced new cookies, caching, and site header tracking methods, iterating on their 2023 reverse proxy tracking technology. Reverse proxy tracking was done to improve website speed thanks to securing a better interaction between your site and services that might slow it down when tacked onto the source code, such as ads, ad-blockers, and web analytics tools.
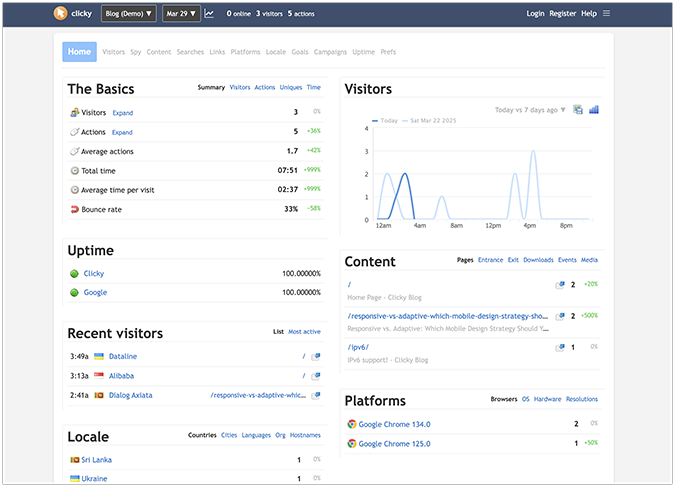
Additionally, while everyone and their AI coding assistant are sprinting toward a sleek, modern, and minimal web UI, Clicky’s user interface still feels like something out of a Web 1.5 era—not cumbersome enough to be unusable, yet not clean enough to showcase a geometrically pleasing web design future.
Still, despite its flaws, Clicky Analytics has a powerful backend infrastructure, ultra-fast data processing times, and a robust set of tracking features, making it a strong GA4 alternative for individual site owners, small businesses, and medium-sized organizations. Large enterprises are likely better off looking at other options.
Does Clicky Analytics Have Any Key Features that Google Analytics 4 Doesn’t?
On its website, Clicky provides a handy comparison table that pits some of its most powerful features against Google Analytics 4, but it’s a bit misleading. GA4 can do most of the things Clicky does, but it takes detailed knowledge of the Google Analytics 4 platform to get it running, and the process of creating something as simple as tracking non-JavaScript users is made more complicated than it needs to be.
With that in mind, Clicky Analytics has two key features that GA4 doesn’t, plus one noticeable drawback:
- Heatmaps and heatmap segmentation
- Built-in GDPR-compliance
- Dark mode (hear us out)
Heatmaps & heatmap segmentation
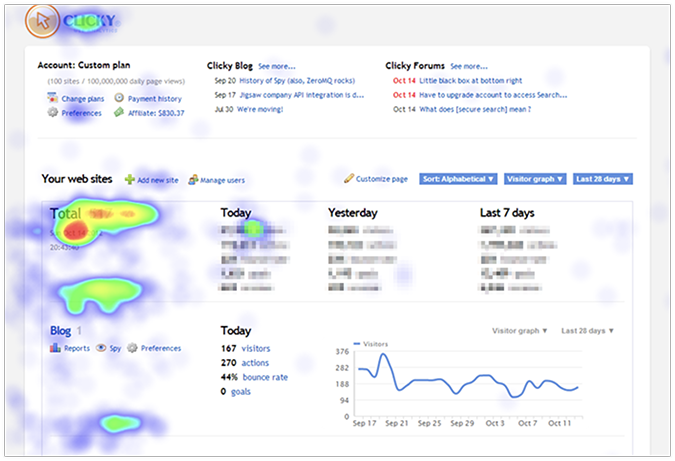
Clicky offers robust heatmap and heatmap segmentation implementations. These features are only available in the Pro Plus or higher-paid plans.
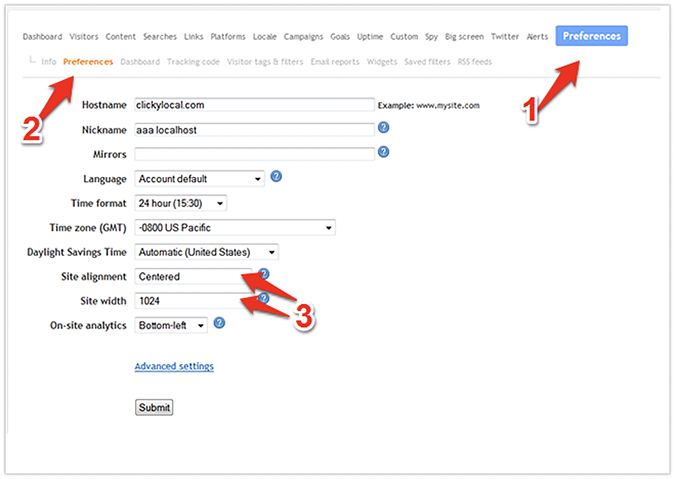
To set up heatmaps in Clicky, go to Preferences, choose your site alignment, and enter your site width. If you have a responsive site, Clicky recommends entering a site width value anywhere between 1200 and 1600 pixels in the corresponding field.
Once your site is properly configured to receive heatmap data, you have three ways to access it:
- By installing and running Clicky’s on-site analytics widget
- By clicking the heatmap icon next to any content that supports heatmap data analysis
- By clicking the heatmap icon next to a visitor session
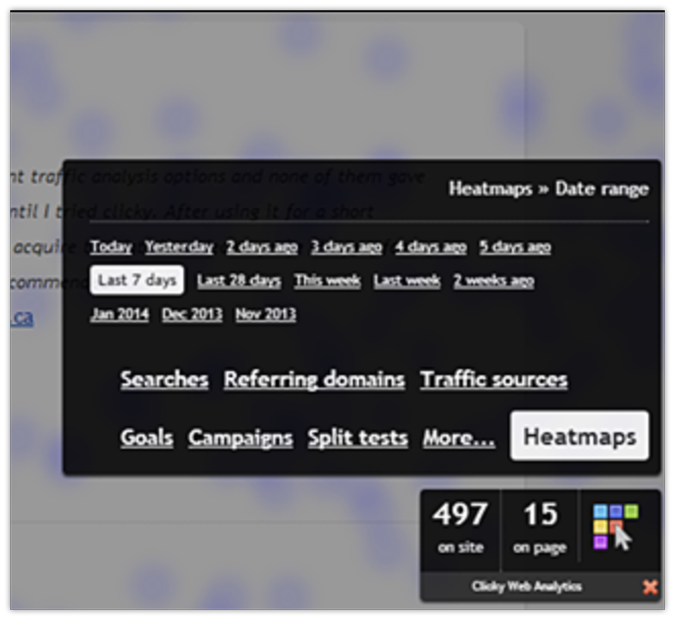

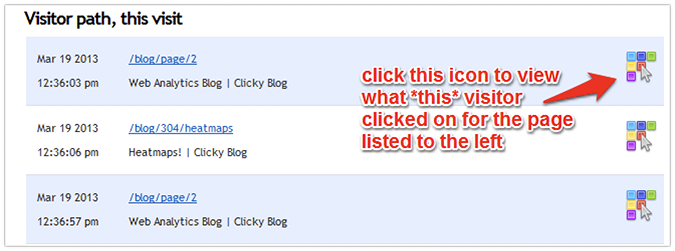
Additionally, you can also segment your heatmap data by visitor sessions, goals, and split tests.
Heatmaps are not available in Google Analytics 4.
GDPR-Compliance
By default, Clicky won’t log, keep, or require any personal data from visitors who are landing on your site. Its privacy feature anonymizes IP addresses, doesn’t track cookies, and automatically opts out visitors from all tracking conditions at a service-wide level. This makes Clicky Analytics privacy-friendly and fully GDPR-compliant.
However, there’s a caveat.
Tracking some metrics with cookies is more accurate. If you change your account’s default privacy settings, Clicky may start collecting some tracking cookies, making both your heatmap data and visitor reports more accurate. However, this action runs the risk of making your site non-GDPR compliant, which opens a different set of privacy-related problems.
So, if you’re unsure, stick to Clicky’s default privacy settings.
Google Analytics 4 is GDPR-neutral. As the user, you’re directly responsible for setting up a GA4 configuration that complies with European and US online privacy laws.
Dark mode
This might sound like a minor omission, and to some extent—it is. However, not having the option to choose between a dark and light theme is a noticeable drawback for any modern application, especially for professionals who use two or more large monitors, typically work at night, and are highly sensitive to those “flashbang” moments when switching between muted and bright applications.
Clicky offers a dark mode toggle for its customers.
Google Analytics 4 doesn’t provide a dark mode option. You can emulate a dark mode using third-party plugins, but not natively via the GA4 platform.
Are the Reports in Clicky Analytics Any Good?
Clicky Analytics features a comprehensive set of reports to encapsulate how users behave on your site, including the pages they visit, the actions they perform, and the areas they click on.
Action log report
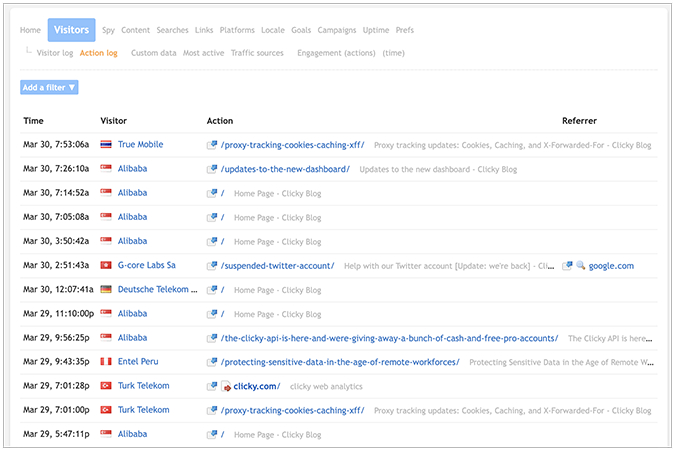
The Action log report (Visitors > Action log) shows several different types of user actions logged for your site, such as the time of page view, the location and username/IP address of the visitor, the URL of the action, and the external referrer if it’s applicable in the particular visitor’s case.
The closest thing to Clicky’s action log in GA4 is the Event Report (Reports > Engagement > Events). In this report, you can filter visitors by page view, session start, first visit, and user engagement. Furthermore, you can also consider the following events: event count, total users, event count per active user, and total revenue.
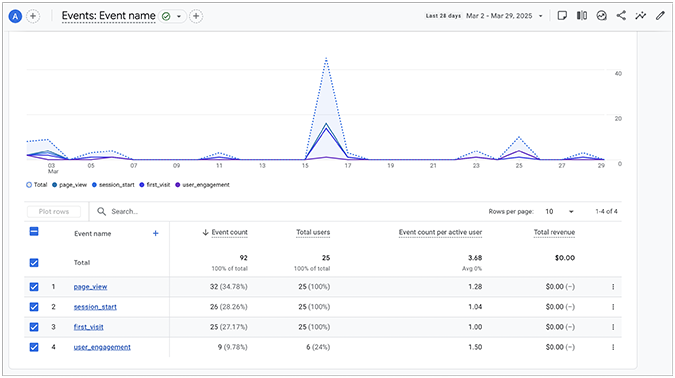
GA4’s event report is not very useful by itself (it doesn’t have time-stamped action logs), so you’re forced to make extensive configuration leaps to get some value out of it.
On the other hand, Clicky’s action log report shows the time-stamped actions of every user interacting with your site, so you can always consult this report to make informed decisions for long-term strategic planning.
Traffic sources report
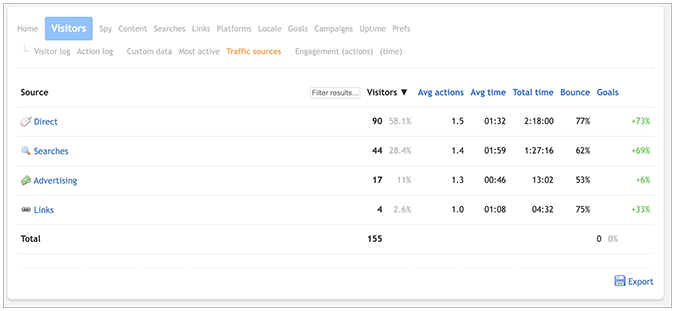
Clicky’s Traffic sources report shows where your visitors are coming from (based on the referrer), and is categorized into direct, advertising, searches, email, social media, syndication, media searches, and links.
GA4 offers the Traffic Acquisition report (Acquisition > Traffic acquisition), where you can monitor key metrics such as sessions, engaged sessions, engagement rate, average engagement time per session, and events per session of the main channel that’s sending traffic your way. These channels are further categorized into direct, organic search, cross-network, email, referral, paid search, affiliates, organic and paid video, and more.
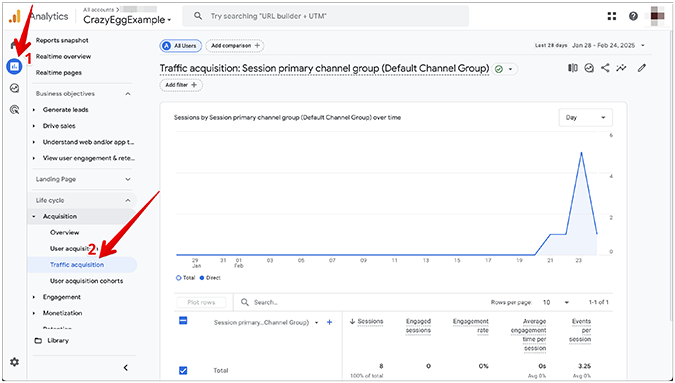
While GA4 features a more detailed traffic acquisition report, it takes significantly longer to set it up. Even then, the report might not work as intended.
On the other hand, the traffic sources report in Clicky Analytics is automatically configured by default, with each visitor being assigned a single traffic source when the visit is recorded. So, you don’t have to configure anything in the backend before you can see where your site’s traffic is coming from.
Pages report
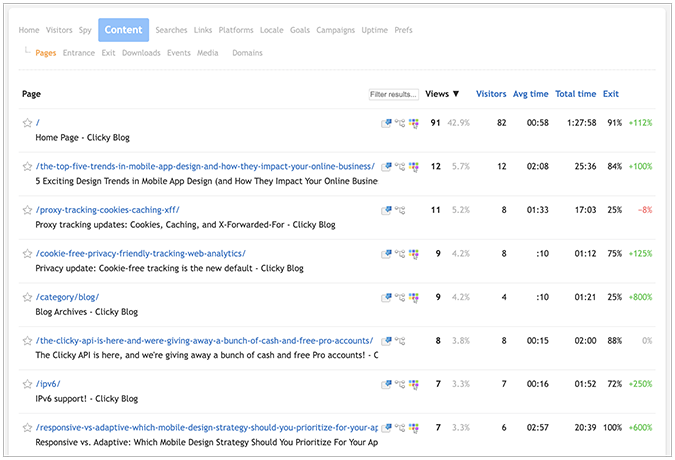
The Clicky Pages report (Content > Pages) shows the most popular pages on your website and is determined by the total number of page views. Key metrics you can view in this report include the number of views, the number of visitors, the average time, the total time, and the exit page expressed in a percentage. You can also access heatmaps from this report if your plan supports them.
The GA4 equivalent of Clicky’s pages report is the Pages and Screens report (Reports > Engagement > Pages and screens). The key metrics you can browse inside the report include views, active users, views per active user, average engagement time per active user, event count, key events, and total revenue.
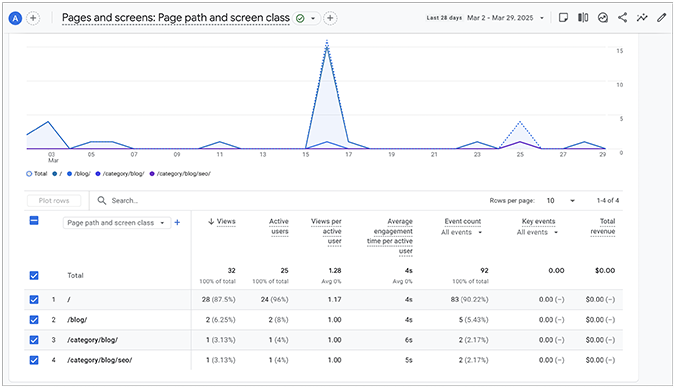
You can additionally customize this report by selecting the following filters: page title and screen class, page path and screen class, page title and screen name, and content group.
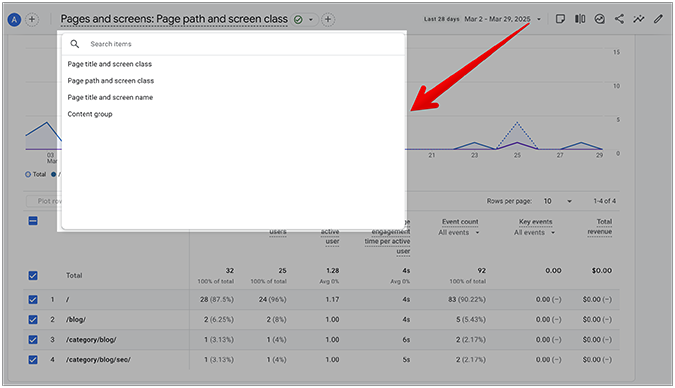
Clicky’s pages report is very easy to navigate, and intuitive to understand—even for first-time users of the platform.
GA4’s pages and screens report is counter-intuitive, contains confusing nomenclature, and is hard to configure without continuous guidance from an experienced GA4 professional. Clicky wins again!
If you’re interested in finding out more about Clicky, here’s an extensive list of the platform’s most used features and reports.
If you want a more in-depth exploration of Google Analytics 4 reports, check out our Google Analytics Guide for Beginners.
How Reliable is Clicky Analytics?
Clicky Analytics shows adequate reliability in data quality because of the inherent robustness of its backend infrastructure, including the way it tracks and interprets visitor information as it happens on your site (real-time data tracking).
Additionally, the platform does a really good job at blocking bot and referrer traffic, which is basically the equivalent of junk traffic, and, in some instances, harmful traffic. However, this approach might lead to some discrepancies compared to GA4, since Google Analytics doesn’t exclude bot traffic from its reports.
On top of that, Clicky uses geolocation software to identify where a visitor comes from and apply your privacy preferences accordingly. According to Clicky, this software is 99.8% accurate at the country level, so it’s fair to expect a small amount of mishaps over a sufficiently large data set (2 inaccuracies in 1,000 samples).
Lastly, Clicky Analytics is more accurate with cookie tracking enabled. Plus, its heatmap data is sampled at 50% by default, so enabling cookies allows the software to shift that randomness from “per page view” to “per session”, thereby leading to better data quality but at the expense of potential visitor privacy infringement.
So, while Clicky performs well in terms of real-time analytics, dynamic goals, and heatmaps, it lacks the granular data segmentation that GA4 can offer. Depending on your goals, you can either go with Clicky for greater data accuracy or run your data through GA4 for a more complete picture of your site’s traffic performance in the wild.
Is Clicky Analytics Free?
Clicky Analytics offers several paid plans, including a free 21-day trial of premium service. You can upgrade your account any time while the trial is active, or even after the trial period has ended.
Here’s a quick rundown of Clicky’s pricing:
- Demo version—lets you get a general feel of Clicky’s features using demo reports and data.
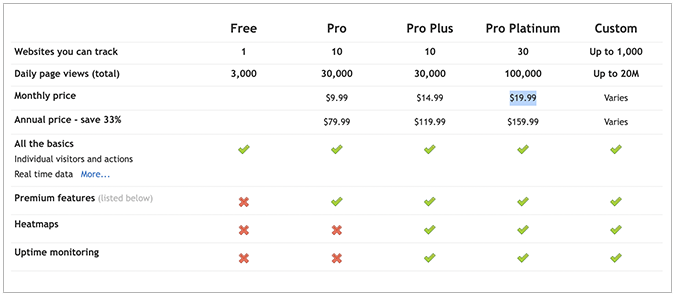
- Free—you can track up to 1 site and process a total of 3K daily page views.
- Pro ($9.99/month)—you can track up to 10 different sites and process a total of 30K daily page views.
- Pro Plus ($14.99/month)—all Pro plan features, plus heatmaps and uptime monitoring.
- Pro Platinum ($19.99)—all Pro Plus features, plus you can process up to 100K daily page views.
- Custom (varies)—you can track up to 1K sites and process a total of 20M daily page views.
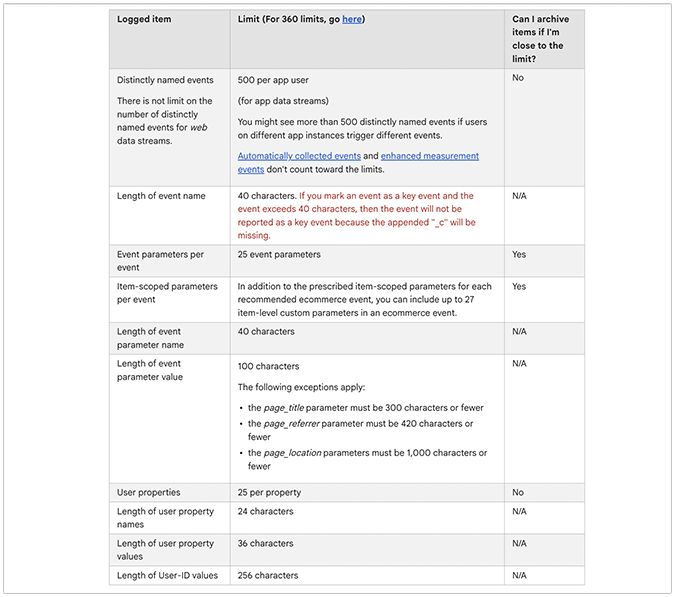
On the other hand, Google Analytics 4 is free but somewhat limited in its data collection capabilities. For example, a free GA4 account only allows you to process up to 500K sessions per report before sampling, 25 event parameters per event, and 50 custom dimensions/metrics per single property. On top of that, BigQuery export is limited to 1M events per day.
Lastly, there’s also Google Analytics 360, which is the enterprise-level version of GA4. The starting cost of GA360 varies, as Google doesn’t explicitly state its cost upfront. According to several different sources, GA360 starts anywhere between $50K and $150K a year, and it includes up to 5M events monthly.


