This guide is aimed at users who want to leverage the most effective GA4 functionalities and skip the rest. We’re going to cut through the complexity and give incoming users exactly what they need from GA4, bypassing the things they don’t.
Warning: People Hate Google Analytics 4
Google Analytics (GA) is a free comprehensive web analytics platform that lets you test, monitor, and record your site or app’s performance over time, which, in theory, leads to better SEO and more effective marketing.
Before July 01, 2023, users were able to access Universal Analytics (also known as GA3), but after July 01, 2023, Google replaced GA3 with Google Analytics 4 (also known as GA4) and removed all access to the old GA3 tool. There were multiple reasons for this change, including outdated technology, improved privacy, updated tracking, and more efficient scripts.
Despite all that, almost all users—including GA3 faithfulls and GA4 rookies—universally dislike the new Google Analytics 4 tool. There are a few exceptions, but the vast majority of people think that GA4 is worse than the previous GA3 version.
So, if you find yourself actively disliking Google Analytics 4, that’s totally normal. This guide will show you how to learn, adapt, and get the most value out of GA4 with the least amount of frustration.
How To Install GA4 in WordPress
Assuming you have an active WordPress site set up and running, here’s a step-by-step explanation of how to install GA4 on a WordPress-powered website.
There are three popular methods to install GA4 on a WordPress-powered website:
- Manually through GA4 (longest method)
- Using Site Kit by Google (safest method)
- Using WPCode Insert Headers and Footers (quickest method)
Adding GA4 manually
1. Go to Google Analytics 4 and log in to your GA4 account.
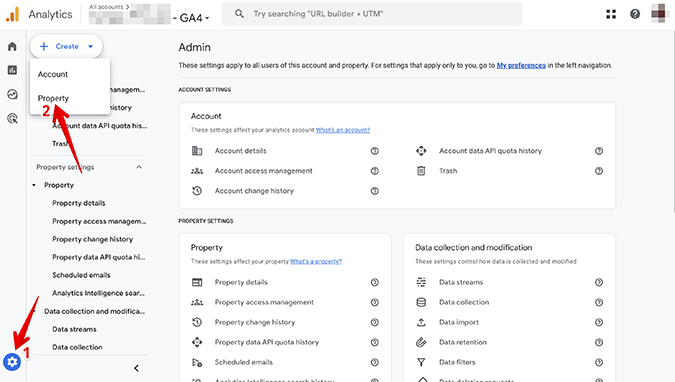
2. Assuming you have an existing GA4 account, click the Gear Icon in the bottom left corner to access the Admin area, then click Create Property to create a new GA4 property.
3. Add the name, time zone, and other important details of your new property.
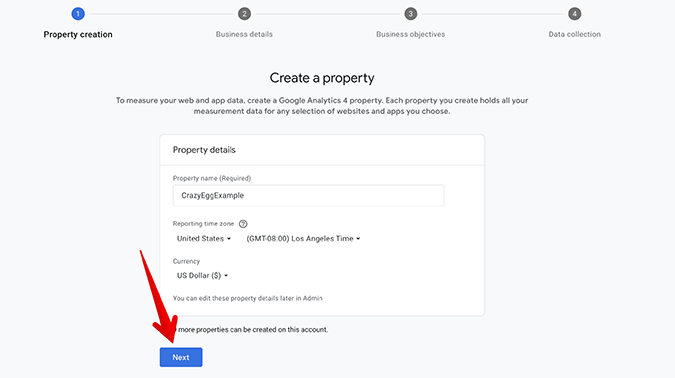
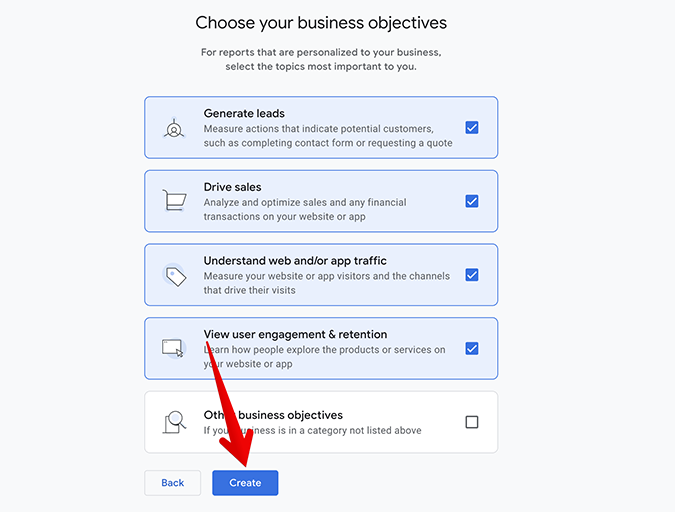
4. Add your business details and business objectives, and click Next until you reach the final prompt. Then, click Create to create your new property.
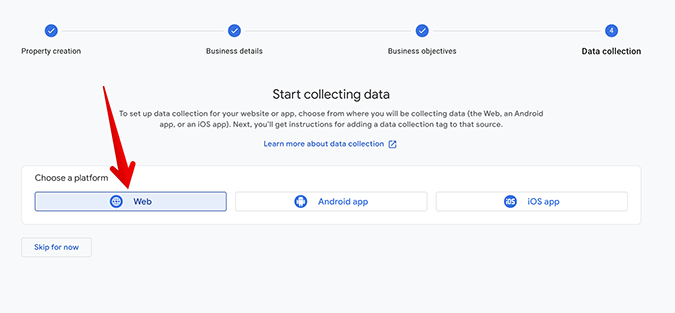
5. From the Start collection data prompt, choose Web.
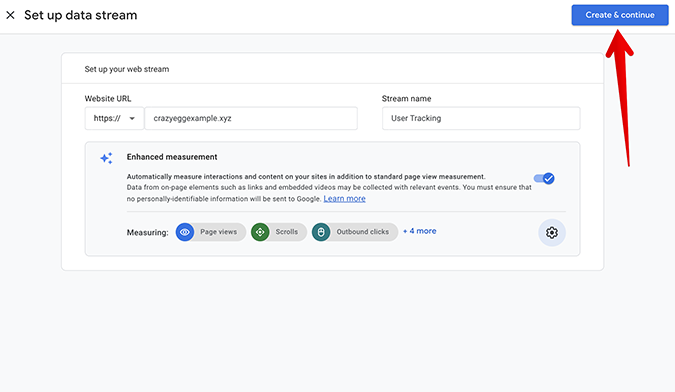
6. A new screen will pop up, prompting you to add your URL, stream name, and other information relevant to your new property. After you’re done adding your information, click Create Stream.
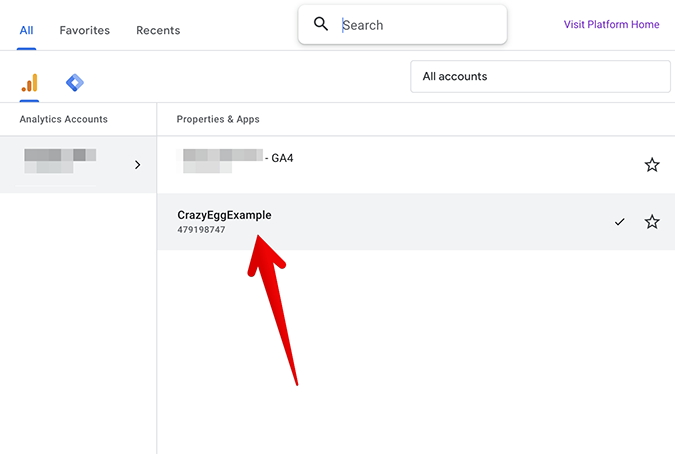
7. Navigate to the Home area in GA4. Click All Accounts > Your Account and select your new property.
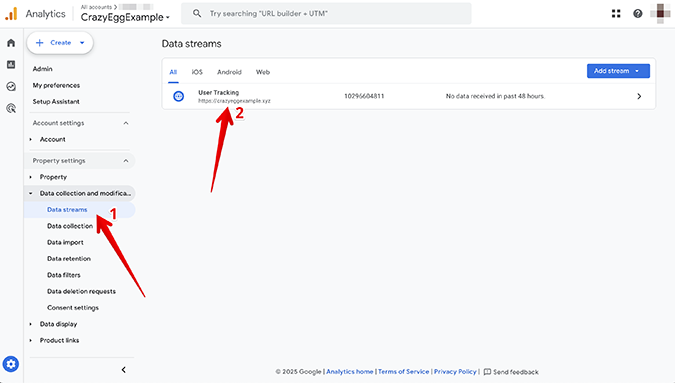
8. From the main navigation menu on the left-hand side, navigate to Property Settings > Data collection and modification > Data Streams. Then, click your recently created data stream.
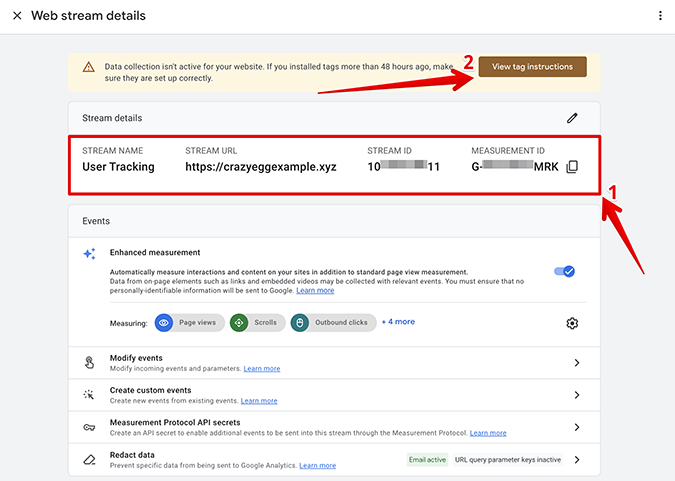
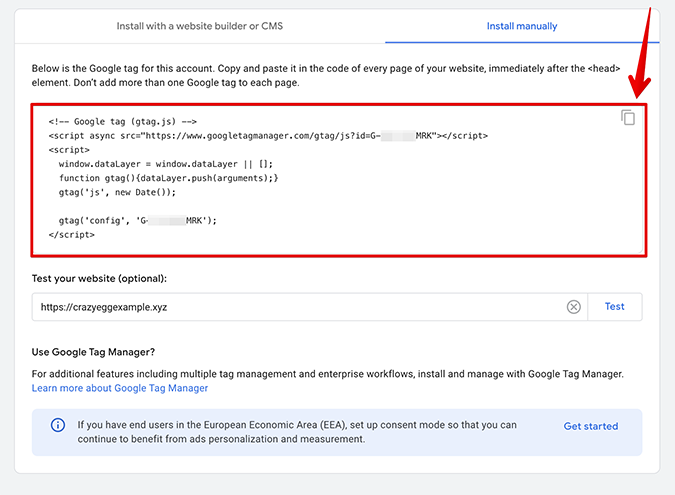
9. Copy your stream details, then click View tag instructions.
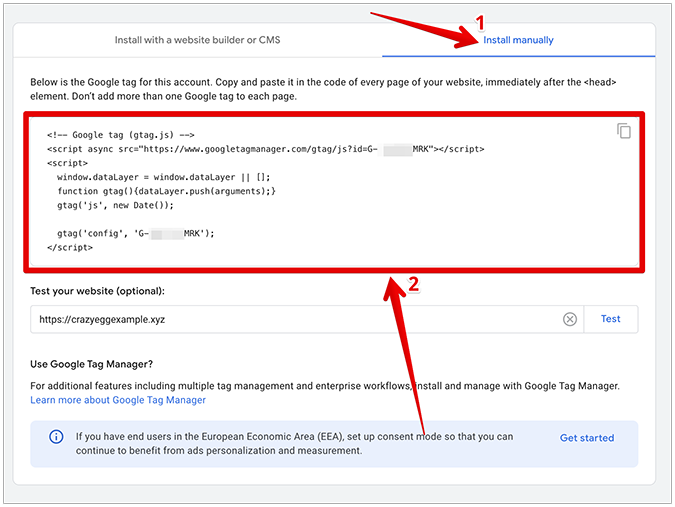
10. Choose Install manually, copy the Google tag code snippet, and add it to every page on your WordPress site after the <head> element.
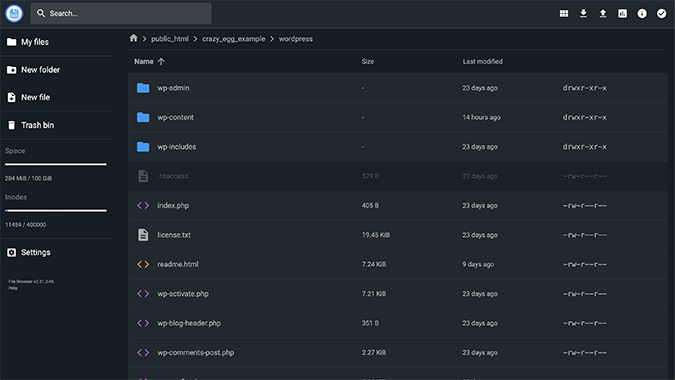
To avoid copying and pasting the code snippet to every page, add instead the Google tag to your master page. You can achieve this with an FTP client like FileZilla, or by editing your pages directly via your hosting provider’s File Manager.
Adding GA4 with Site Kit by Google
1. Repeat steps #1 through #9 from the previous guide to create a new property and add a new data stream.
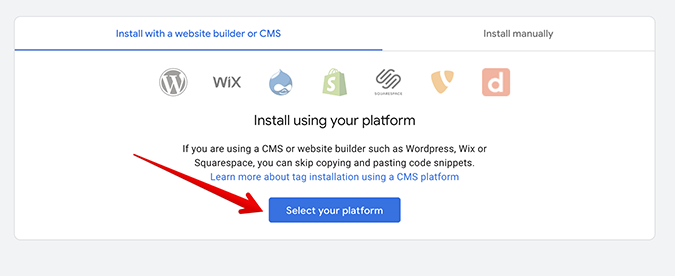
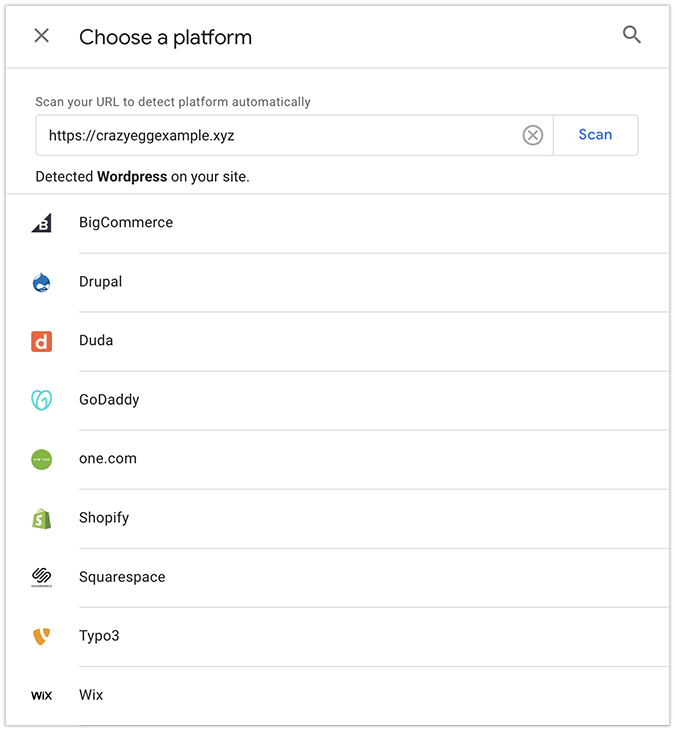
2. Click View tag instructions and choose Install with a website builder or CMS. Then, click Select your platform.
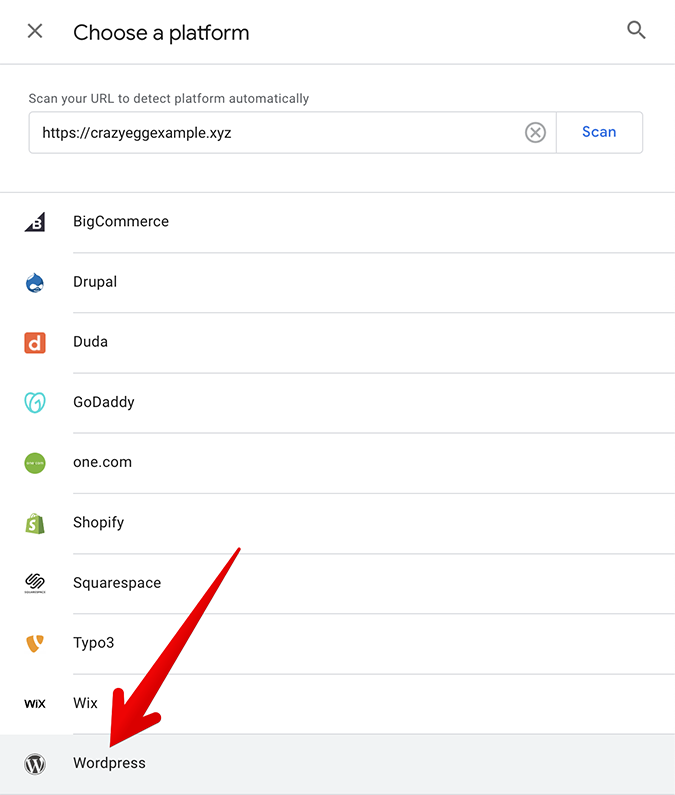
3. Choose WordPress.
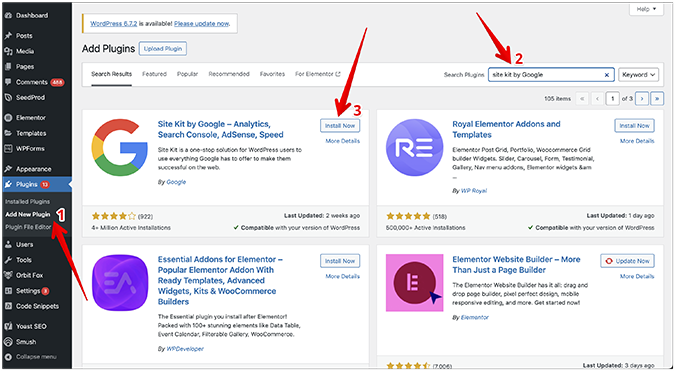
4. Login to your WordPress site as administrator. Navigate to Plugins > Add New Plugin and type Site Kit by Google in the search bar. Click Install Now.
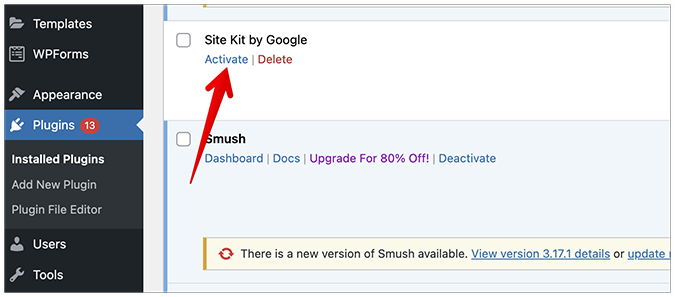
5. Navigate to Plugins > Installed Plugins, scroll until you find Site Kit by Google, and click Activate.
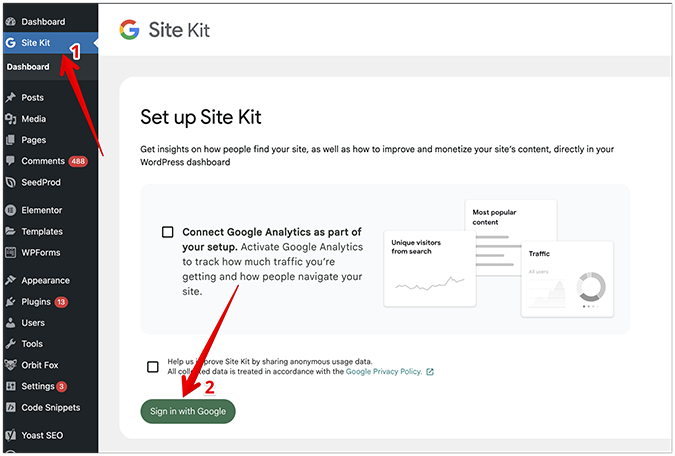
6. Select Site Kit from the left-hand side, then click Sign in with Google.
7. Choose the account with your recently created property. Click Continue.
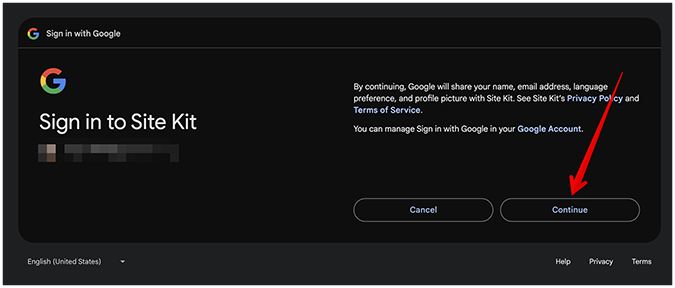
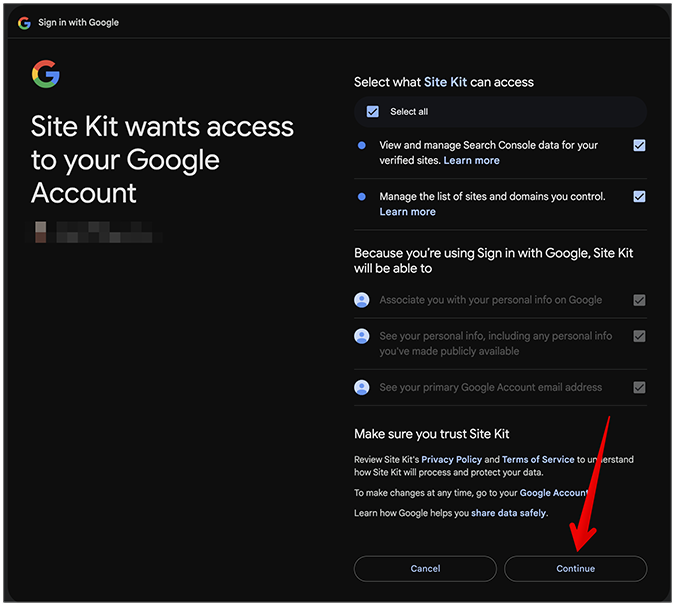
8. Grant the necessary permissions, and click Continue.
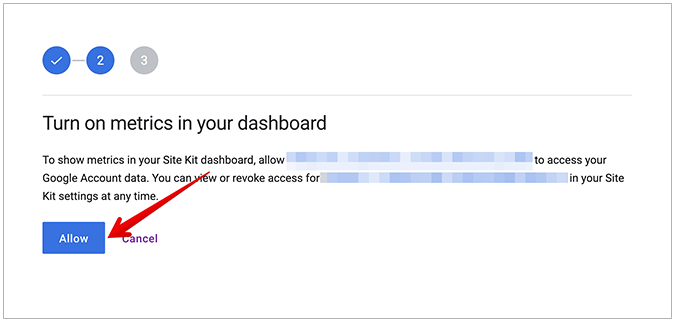
9. Click Allow to enable GA4 access to your website.
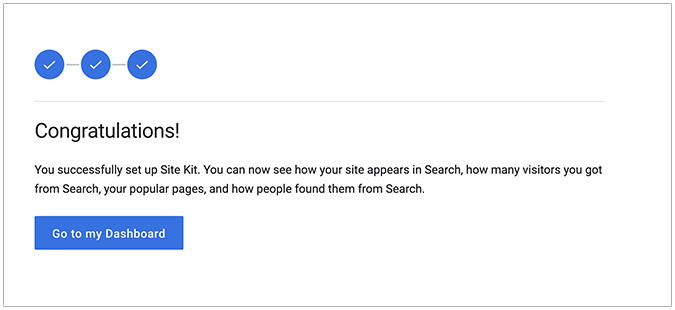
10. Click Add Site, then click Set up Google Analytics. Choose your recently created property, and click Complete Setup. You should see a “Congratulations!” message upon setup completion.
Adding GA4 with WPCode – Insert Headers and Footers
1. Repeat steps #1 through #9 from the first guide to create a new property and add a new data stream.
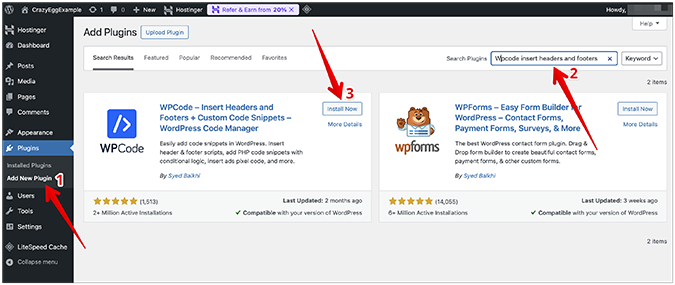
2. Navigate to Plugins > Add New Plugin, type “Wpcode insert headers and footers” in the search bar, and click Install Now.
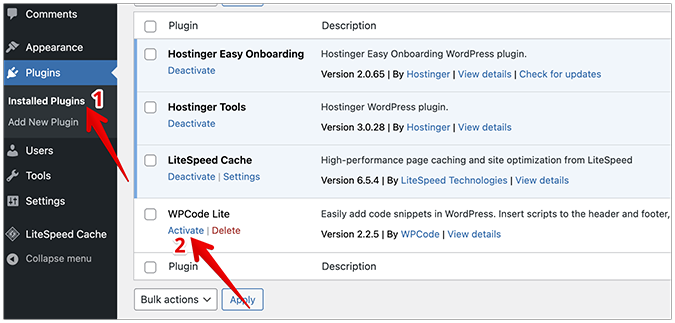
3. Go to Plugins > Installed Plugins, locate WPCode Lite, and click Activate.
4. Login to your GA4 account. Navigate to Property Settings > Data collection and modification > Data streams. Click on your recently created data stream.
5. Click View tag instructions, then select Install manually. Copy the Google tag for your selected account.
6. Navigate to Code Snippets > Header & Footer, paste your Google tag in the Header section, and click Save Changes.
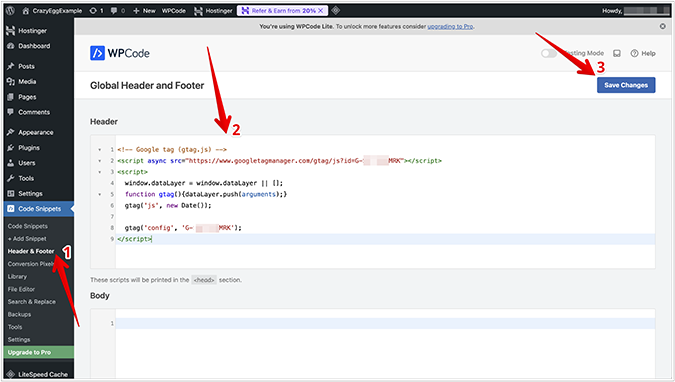
GA4 should now be successfully added to your WordPress site.
Adding GA4 to non-WordPress sites
Other, non-WordPress site builders such as Wix, Duda, Drupal, Squarespace, BigCommerce, and Shopify also allow full GA4 integration with your website. If your site happens to use one of these builders, you can add GA4 in two main ways, including:
- Manually with a measurement ID (formerly known as tracking code) or a Google tag code snippet
- Using the GA4 onboarding process
To add GA4 manually, first select your new property, then navigate to Property Settings > Data collection and modification > Data Streams. Click on the data stream associated with your recent property and copy your data stream details to the clipboard. Login to your website builder’s account and look for GA4 integration settings where you can paste your data stream details to connect your GA4 account.
Navigate to Property Settings > Data collection and modification > Data Streams > View tag instructions > Install manually to access the Google tag code snippet for your account.
To add GA4 using the GA4 onboarding process, repeat steps #1 through #9 from the first guide, click View tag instructions, then click Install with a website builder or CMS, and choose your current website builder from the prompt. Finally, follow the instructions provided by the GA4 installation guide to connect your GA4 account with your website.
Critical Settings You Must Configure in GA4
Google Analytics 4 is not a tool you simply install once and forget about it forever. There are settings you must configure to get the most out of GA4, even changing some default settings to get the reports you want.
Here are the top 3 critical settings you must adjust in GA4 for the best long-term site monitoring experience.
1. Change your data retention value
Select your property, then navigate to Admin > Data collection and modification > Data retention, and change the default data retention value from 2 months to 14 months. Click Save to save your changes.
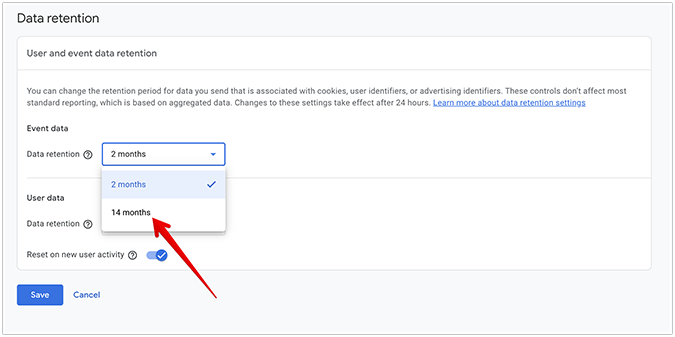
This ensures that you see data older than 2 months in the Explore section, improving your reports and driving a better decision-making process thanks to deeper insights and a more detailed historical analysis.
2. Exclude traffic from your IP address
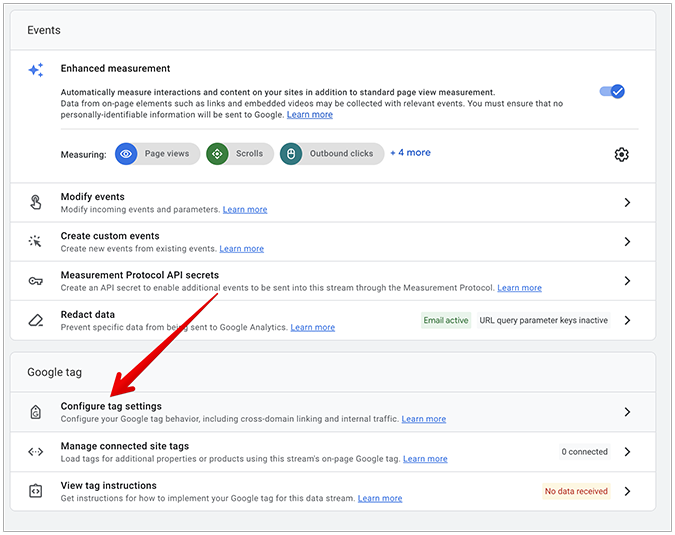
GA4 will record your visits or visits from work colleagues on your website by default, giving you a skewed report of your site’s traffic performance. To prevent this, navigate to Admin > Data collection and modification > Data streams. Click your website’s data stream, then click Configure tag settings under the Google tag section.
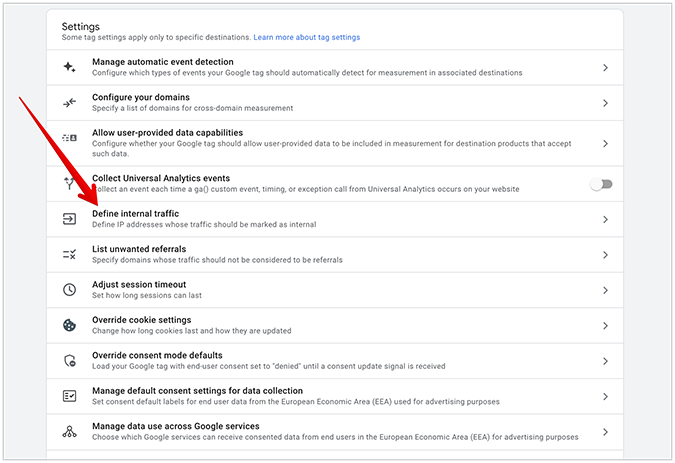
Click Show more, then click Define internal traffic.
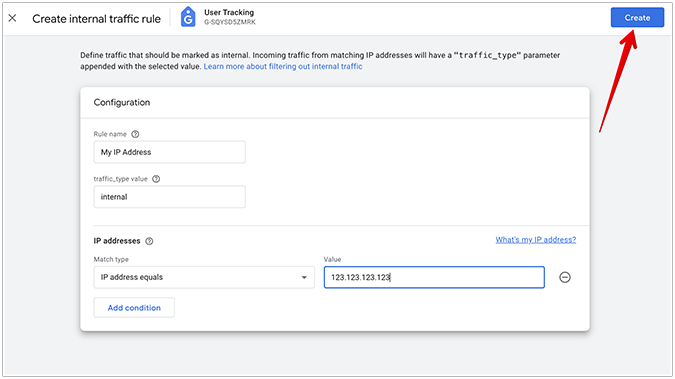
Click Create.
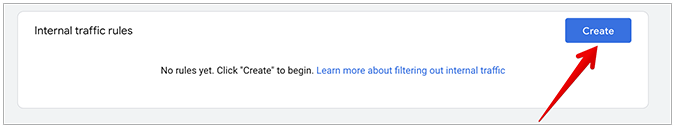
Enter your IP address details, including name and value. Under Match type, choose IP address equals to exclude a single IP address or IP address matches regular expression to exclude multiple IP addresses from being recorded as incoming traffic by GA4.
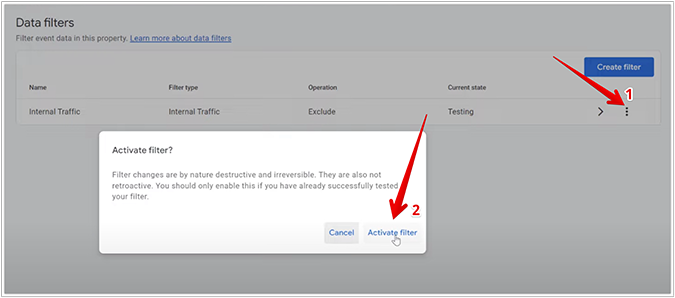
Navigate to Admin > Data collection and modification > Data filters. Click the three dots next to Internal Traffic, and click Activate Filter twice to confirm the command.
This change won’t affect your historical data, but it will affect future incoming traffic from excluded IP addresses (it won’t display traffic in your future reports coming from excluded IP addresses) and display data in the debug view (it won’t show events in the debug view coming from excluded IP addresses).
3. Enable user demographics data tracking
GA4 doesn’t track user demographics data (age, gender, interests) by default. To enable this, navigate to Admin > Data collection and modification > Data collection. Next to Google signals data collection, click Turn On.
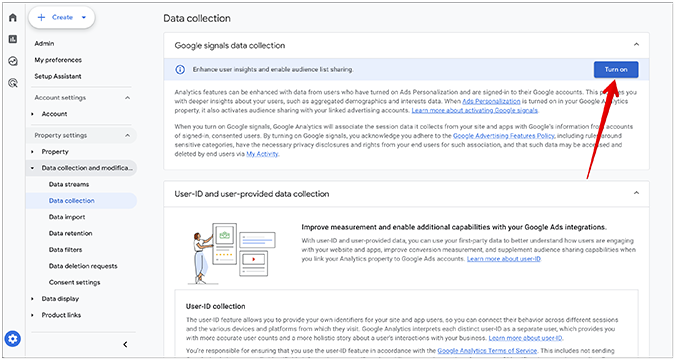
Note that GA4 won’t be able to display demographic data for all users, but for some of them, you’ll be able to see their age, gender, and interests in your reports after enabling this key setting.
The 2 Essential GA4 Reports
There are two key GA4 reports you should pay special attention to:
- Landing Page report
- Traffic Acquisition report
Here’s how they work.
Landing Page report
The Landing Page report is a comprehensive report (what’s known as a “detail report” in GA4) that helps you understand how visitors arrive on your website. Specifically, it shows what pages drive new visitors to your site, as well as how many users land on any specific page.
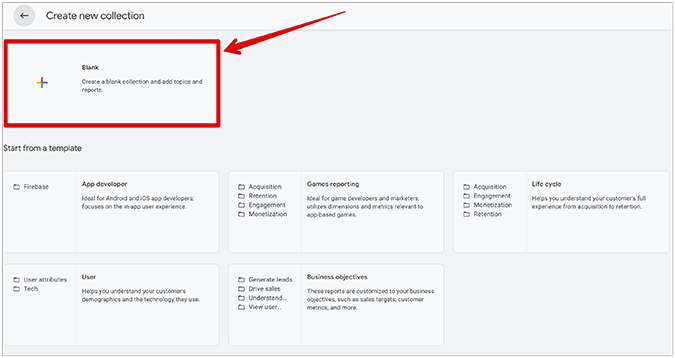
Sometimes, some reports won’t appear in your GA4 dashboard by default. To add a Landing Page report, navigate to Reports > Library, and click Create new collection.
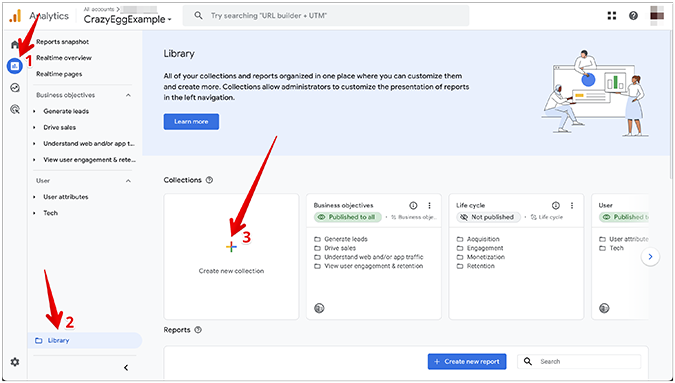
Click Blank (Create a new collection and add topics and reports).
Under Topics and Reports on the left-hand side, click Create new topic. Name your report and click Apply. Then, drag your Landing Page detail report from the right area into the Drop detail report box. Click Save to save your changes.
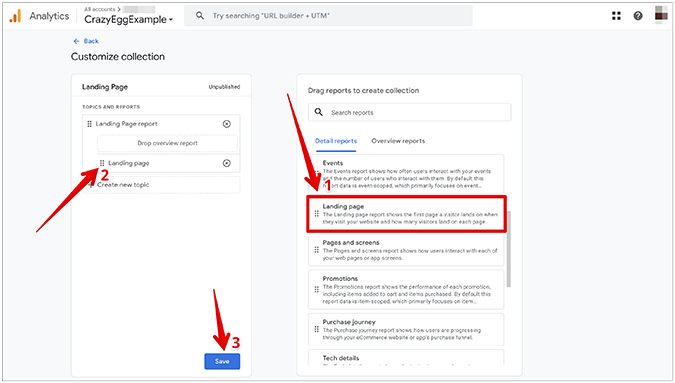
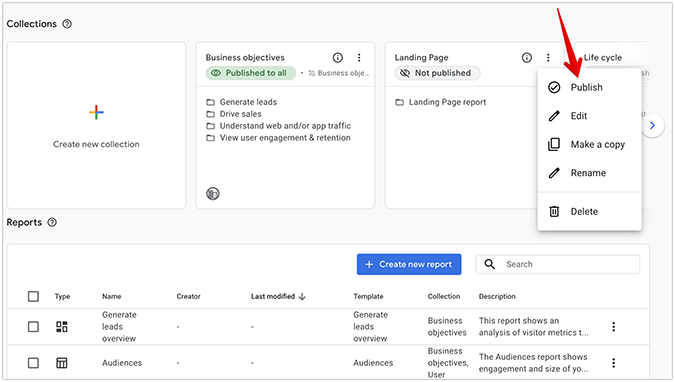
From the Reports > Library area, locate your new collection, click on the three vertical dots, and click Publish.
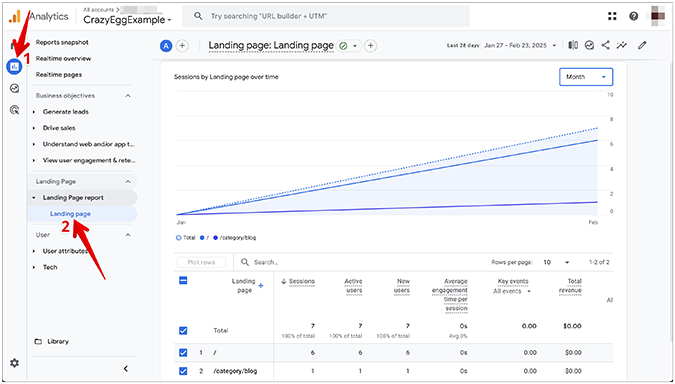
To access your Landing Page report, navigate to Reports > Your Collection Name > Your Landing Page report name. In our case, this report was under Reports > Landing Page report > Landing Page.
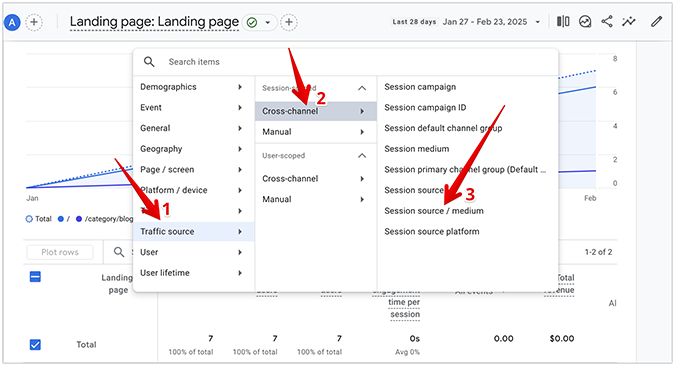
In addition to showing the specific pages that users land on your site, you can also configure the Landing Page report to show where exactly those same users came from before they landed on your website. To add this new dimension and use sessions as your primary counter, click the plus sign next to Landing Page in the Landing Page report, then choose Traffic source > Cross-channel under Session-scoped, and choose Session source/medium.
Additionally, you can also use the Landing Page report in combination with Real Time overview to check the average time that users spend on your site, including the average time users spend during a single browsing session.
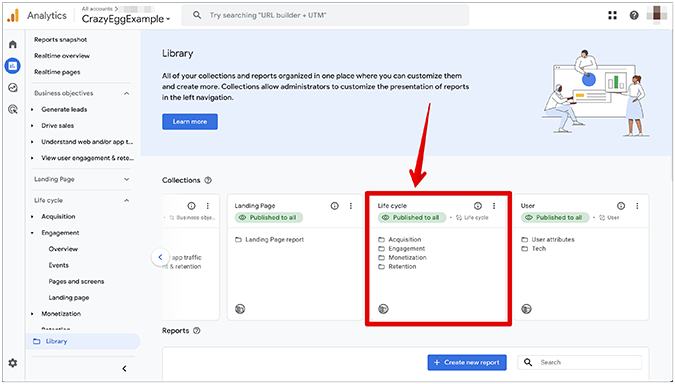
To do this, go to Reports > Library. There, you should find an unpublished collection called Life Cycle. By default, it should include Acquisition, Engagement, Monetization, and Retention. Click the three vertical dots next to it, and click Publish.
Lastly, navigate to Reports > Life Cycle > Engagement > Overview. Here, you can check both the average engagement time per active user and the average engagement time per session.
Traffic Acquisition report
The Traffic Acquisition report is also a “detail report” that helps you figure out where your site visitors are coming from. It shows both where new (users who visit your site for the first time) and returning (users who have visited your site before) users are coming from to visit your site.
To enable the Traffic Acquisition report in your GA4 dashboard, navigate to Reports > Library, and publish the existing collection called Life Cycle by clicking the three vertical dots next to it and choosing Publish.
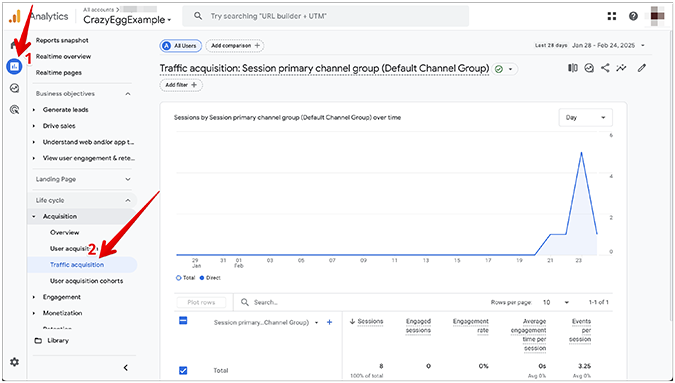
Next, navigate to Reports > Acquisition > Traffic acquisition.
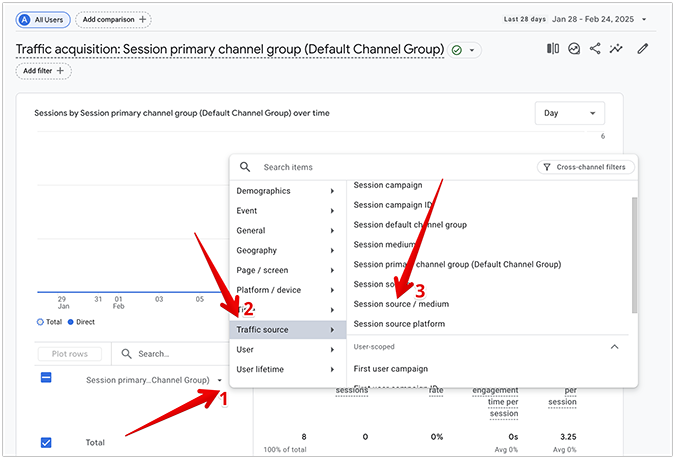
To see the actual breakdown, click the plus sign next to the name of your traffic acquisition channel, and choose Traffic source > Session source/medium.
Here are some common GA4 metrics in the Traffic Acquisition report and what they mean:
- Session—One session is counted from when a user lands and starts interacting with your site, all the way until they leave your site or become inactive after 30 minutes.
- Engaged sessions—One engaged session equals a session that lasted longer than 10 seconds, had 2 or more page or screen views, or had a conversion event taking place.
- Engagement rate—The number of engaged sessions divided by the total number of sessions, shown as a percentage.
- Average engagement time per session—The average duration of user engagement per a single session.
- Events per session—The average number of events per a single user session.
- Event count—The total number of events triggered by users.
- Key event—The total number of key events triggered by users. Unlike the other metrics which are automatically populated, you can populate this metric by marking any event as a key event.
- Session key event rate—The number of sessions featuring a key event divided by the total number of sessions, shown as a percentage.
- Total revenue—The number of your total revenue calculated as Purchase revenue plus Subscription revenue plus Ad revenue.
Ultimately, it’s up to you how to use the GA4 reports, including what conclusions you draw from them. At the end of the day, GA4 is only as useful as the person who analyzes the information and makes decisions based on hard data.
How To Actually Use GA4 as a Beginner
That said, however, here are some general tips on getting the most out of GA4.
First, check and record your monthly total traffic. While analyzing traffic as a metric isn’t an end-all-be-all solution to all your site’s woes—if it’s going up, it means that you’re probably doing something good on the back end. If your traffic is tanking, you can check the most impacted pages and devise a strategy to either create new pages (articles, listicles, something else your audience wants), prune your existing content, or shift gears towards a different niche.
Next, check your channels and traffic sources occasionally (it’s recommended to do that every few months) to get a rough estimate of which marketing channels are having an impact on your site’s overall performance over a given data range. Remember, you can always hunt for new channels to source traffic back to your site.
Finally, perform the same maintenance steps for landing pages, checking them every few months. Then, go through the top-performing landing pages to make sure they’re as good as they could be, and, if possible, delete the ones that aren’t having a positive impact on your site’s performance in SERPs.